
Total Float vs. Free Float in Construction Scheduling: What's the Difference?
Free float vs total float comes down to one question: does the delay affect the next task, or the whole project's finish date? Total float is the amount of...

Blog
In essence, float can offer a buffer against unexpected changes, allowing activities to be postponed without impacting the overall end date.

U
nderstanding float in CPM scheduling is foundational to achieving data-driven construction project controls. It helps project teams answer practical questions:
In essence, float can offer a buffer against unexpected changes, allowing activities to be postponed without impacting the overall end date. But float should not be trusted blindly. It is a byproduct of schedule logic. When that logic is incomplete, float expands artificially. When execution slips, float erodes.
Understanding float is less about finding buffer and more about understanding how much risk exists in the schedule.
Float in CPM is the amount of time an activity can be delayed without delaying either the next activity or the overall project completion date.
There are two primary types of float:
In construction project controls, float is used to identify the critical path, monitor near-critical work, prioritize resources, detect missing logic, and track schedule risk over time. Low or declining float is an early warning signal that the project is losing flexibility.
Float in CPM schedules is not one single number that answers every scheduling question. Different float values tell you different things about schedule flexibility, sequencing risk, and end date confidence.
The two most important types of float in construction schedules are:
Both matter. Total float helps identify the critical path and overall schedule risk. Free float helps identify short-term handoff risk between activities, trades, or crews.
For example, an activity may have 20 days of total float but zero free float. That means the activity can slip without immediately delaying the project finish date, but any slip will delay the next activity in sequence. In the field, that can create coordination problems long before the project end date moves.
Total float is the amount of time an activity can be delayed without pushing back the overall project completion date.
It is the broadest measure of schedule flexibility and the primary metric used to identify the critical path. Activities with zero total float are, by definition, driving the project’s finish date.
Total float is generally calculated by subtracting an activity’s early finish date from its late finish date. When that number is zero, there is no room for delay. When it is positive, the activity has some breathing room. When it drops below zero, the schedule has moved into negative float, and the finish date it reports is no longer supported by its own logic.
A few things total float does not tell you:
For project controls purposes, total float is most useful as a portfolio-level signal. It tells you at a glance which activities are critical, which are near-critical, and which have genuine flexibility.
The risk is treating high total float as a sign that an activity requires no attention. Float can erode quickly. By the time an activity with 30 days of float becomes critical, the window to act may already be closing.
Total float is also a shared project resource. When multiple activities sit on the same path, they draw from the same float pool. One delay consumes float for every downstream activity. That is why float should be treated as project risk capacity, not individual task flexibility.
Scenario testing makes that shared exposure visible. It shows how spending float on one path can pull a near-critical activity onto the critical path before the decision is locked in.
Free float is the amount of time an activity can be delayed without affecting the early start of any immediate successor.
It is a more localized measure than total float. Instead of measuring impact on the project end date, free float measures impact on the next activity in sequence.
An activity can have significant total float but zero free float. This means the activity has room to slip without affecting the project’s completion date, but any slip at all will immediately push back the activity that follows it.
In a multi-trade environment, this distinction matters.
A delay in one trade’s activity may not show up on the project end date for weeks, but it can block the next trade from starting on time the very next day.
Free float is particularly valuable for identifying trade handoff risk. An activity with zero free float means any slip immediately impacts the next trade, even if total float still exists at the project level.
Free float is also useful for:
The practical difference between total float and free float comes down to this: total float tells you how much time you have before the project is affected, and free float tells you how much time you have before the next activity is affected.
Both numbers matter, but they answer different questions. Confusing one for the other leads to resource prioritization mistakes that show up in the field.
It is also common for schedules to show significant total float but zero free float. In these cases, the project finish date may appear protected, but sequencing risk exists between trades. This is often where field conflicts emerge before the schedule shows any delay.
|
Comparison Point |
Total Float |
Free Float |
|
What it measures |
Delay allowed before the project finish date is affected |
Delay allowed before the next activity is affected |
|
Primary use |
Identifying critical and near-critical paths |
Managing trade handoffs and short-term sequencing |
|
Schedule level |
Project-level flexibility |
Activity-to-activity flexibility |
|
Common risk |
Treating shared float as individual buffer |
Missing immediate handoff impacts |
|
Example |
An activity can slip 10 days before delaying final completion |
An activity can slip 2 days before delaying the next trade |
|
Project controls value |
Shows end date exposure and criticality |
Shows near-term coordination risk |
A simple way to remember the difference:
Both should be monitored. Total float helps leadership understand project completion risk. Free float helps project teams understand field coordination risk.
Float is calculated from the early and late dates generated by the CPM network.
The most common total float formulas are:
Both formulas should produce the same result when the schedule logic is consistent.
Free float is commonly calculated as:
In practical terms:
These formulas are useful, but the calculation is only as reliable as the schedule logic behind it. Missing predecessors, missing successors, excessive constraints, and missing crew logic can all distort float values.
That is why float analysis should be part of a broader schedule quality review, not a standalone exercise. For teams evaluating the tools and workflows that support this analysis, SmartPM’s guide to construction scheduling software breaks down what to look for in scheduling platforms.

Differentiating between an activity with two months of float and one with zero float is extremely important for managing resources.
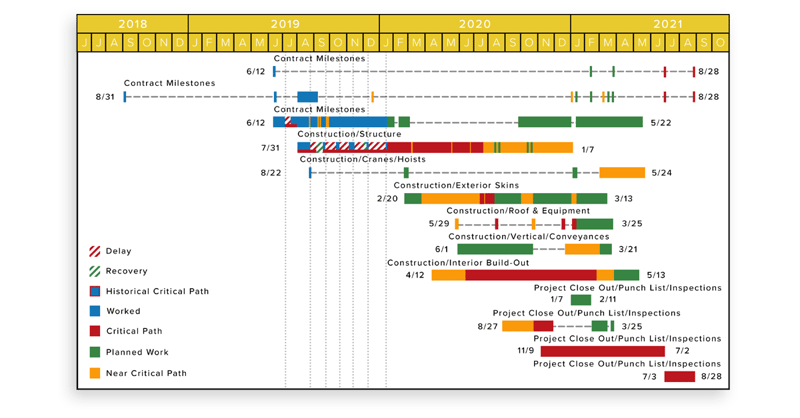
Everyone can see a red path surrounded by green and blue activities. But float values are what indicate an activity’s criticality, making them a practical signal for prioritizing resources.
If an activity has zero total float, it is driving the project finish date. If it slips and no acceleration occurs, the project completion date slips with it. If an activity has very little float, it may not be critical today, but it may become critical quickly.
However, float should not be used as the sole driver of resource decisions.
Artificial float caused by missing logic or incomplete phasing can make low-priority work appear flexible when it is not. Resource constraints can also make available float unusable in practice.
For project controls teams, float should be reviewed alongside:
Float helps identify resource priority, but it should be interpreted in context.
Think of the critical path, often highlighted in red, as your high-priority task list.
These are the activities where prioritizing resources and effort is most important to meet the project deadline. If any of these tasks are delayed and no acceleration happens to make up for it, the entire project will be delayed.
In CPM scheduling, the critical path is the longest path through the schedule network and determines the shortest possible project duration. Activities on the critical path typically have zero total float.
The term “critical” does not mean the work is more technically complex or more expensive than other work. It means the work has no schedule flexibility.
That distinction matters. A small administrative task can be critical if it sits on the path driving completion. A large construction activity can be non-critical if it has float. Float is what tells you where time flexibility exists and where it does not.
For additional context on how CPM schedules compare to other schedule formats, see SmartPM’s guide to the top types of construction schedules.
Activities closely following the critical path are known as the near-critical path.
These activities may not be on the critical path today. However, they still matter because they have minimal float. If they slip, they can quickly become critical.
Activities with a total float value of less than 10 days should generally be considered near-critical. They require attention because they can quickly move onto the critical path if delayed. In particular, activities with less than five days of float should be treated with similar urgency as those on the critical path.
The threshold can vary depending on project size and complexity. A 10-day float threshold may be appropriate for one project and too narrow or too broad for another. The key is to define near-critical rules consistently and monitor them across schedule updates.
Consider a project where the critical path consists of foundation work, framing, and roofing. These tasks are non-negotiable in their timelines.
Meanwhile, tasks like electrical wiring or plumbing may have a bit more float but are near-critical. If the plumbing task has only four days of float, a delay there could quickly affect the critical activities that follow, such as fixture installation or inspections.
This is why near-critical work deserves active attention. It may not be driving the finish date today, but it may be one update away from becoming the reason the project slips.
Relying on float values to make decisions is a proven tactic for resource management. However, scheduling has many pitfalls if you are unaware of best practices.
When reviewing a CPM schedule, analyze:
If a large percentage of activities have more than two months of float, it may indicate missing logic in the schedule. High float is not always good news. Sometimes it means the schedule is not connected well enough to tell the truth.
This is where construction analytics can help. Float becomes more valuable when it is tracked over time, benchmarked across projects, and connected to schedule quality metrics.
Excessive float is often not real flexibility. It is a symptom of missing logic.
Large gaps between activities create the appearance of schedule cushion when no real buffer exists in execution. That is where a logic integrity assessment becomes essential. It flags the missing relationships that inflate float before the team starts making decisions based on numbers that do not reflect reality.
The most important rule in CPM scheduling is that every activity, except the first and last, must have a predecessor and successor.
Without logic, float opens up. Typically, the more float opens, the more compressed the schedule becomes. By design, activities start stacking on their own, resulting in an erroneous critical path.
Hard logic is usually present within the schedule. For example, you cannot pour concrete before forms are complete. But crew logic is often missing, which causes timelines to become compressed and unrealistic.
That artificial stacking is also why compressing a project schedule built on missing logic rarely holds. The plan is chasing phantom float instead of a real critical path.
Crew logic is a form of soft logic that assigns relationships to activities based on where a crew will move next, considering means, methods, and constraints.
By connecting activities based on how work actually flows, crew logic represents the movement of work in your schedule, not just contractual sequencing.
For example, if one drywall crew is working floor by floor through a building, the schedule should reflect that movement. If each floor is shown as independent with no crew flow logic, the schedule may show unrealistic float and an inaccurate critical path.
Excessively high float across many activities suggests missing crew logic.
Additionally, if the critical path flows straight through the project without considering the trades involved, it is likely missing crew logic.
For example, if you were building a high-rise with 80 floors and only the top floor was deemed critical, but the schedule does not account for trades working through the intermediate floors, there would likely be an issue.
The schedule may technically calculate, but it may not reflect how the project will actually be built.
Constraints can mask float erosion.
A constrained schedule may show stable float values while risk is actually increasing behind the scenes. Placing constraints on activities, particularly finish constraints, can complicate schedule analysis.
Constraints can turn activities with float values between 0 and 30 days red, making them seem critical. In those cases, the critical path may no longer reflect the true driving factors of the project.
Constraints are not always wrong. Some constraints are legitimate, such as owner-mandated milestones, access dates, permit dates, shutdown windows, or turnover requirements. The issue is when constraints are used to force dates rather than reflect real project requirements.
When constraints are overused, float becomes harder to trust.
Project teams should review:
A schedule can show a finish date that appears stable while float is deteriorating underneath it. That is a project controls warning sign.
Negative float occurs when the schedule logic shows that an activity cannot finish by its required late date.
In practical terms, negative float means the schedule is already behind the date it is trying to meet. The reported finish date is not supported by the current sequence, durations, constraints, and progress in the schedule.
For example, if a project must finish by June 30 but the CPM logic shows the earliest achievable completion date is July 10, the schedule may show 10 days of negative float.
Negative float is important because it often signals:
Negative float should not be ignored or hidden. It is one of the clearest indicators that schedule recovery planning is needed.
Project controls teams should ask:
Negative float does not automatically mean the project cannot recover. It means the current schedule logic does not support the required date without corrective action.
Float ownership is one of the most debated topics in construction scheduling.
In many project environments, float should be treated as a shared project resource, not a private buffer owned by one contractor, subcontractor, or stakeholder. When multiple activities sit on the same network path, they often draw from the same float pool. If one party consumes that float, less flexibility remains for everyone downstream.
This matters because float consumption can create disputes.
A subcontractor may believe an activity had available float and therefore a delay did not matter. The owner or general contractor may argue that the same float was needed to protect a future milestone or another trade handoff.
The best way to manage float ownership is through transparency:
Float is not just a scheduling calculation. It is a governance issue.
When teams understand float as shared risk capacity, they make better decisions and reduce the likelihood of schedule disputes.
There is no universal “correct” float value.
Acceptable float depends on project structure, phasing, permitting constraints, sequencing strategy, and the type of work being performed. Multi-phase projects may naturally show high float, while linear projects may operate with very little.
For linear projects, I recommend minimizing float and lengthening the critical path to ensure steady project progression. For horizontal and vertical projects, it is vital to maintain a reasonable amount of float for all parties.
A strategy to achieve this is by integrating crew logic into the scheduling process, which ensures that labor constraints are taken into account.
The goal is often to have a month or less of float in CPM. Shorter float durations allow for clearer visibility into when and where impacts happen. Having a tight schedule, meaning one that thinks through all necessary logic, allows for clear identification of the critical path that drives the project.
This kind of schedule control ensures any impacts to the schedule can be identified and addressed promptly.
The key is understanding whether float is structural or artificial.
To determine acceptable values of float, consider the following:
Complex projects typically need more wiggle room to account for uncertainties. Assess the complexity by considering:
Review float values from similar projects in the past to identify patterns. Look at:
Historical project data can help teams understand what “normal” float looks like for similar work.
Consider potential risks that could impact your schedule, such as:
Float should be interpreted in relation to risk. A high-risk activity with limited float deserves more attention than a low-risk activity with the same float value.
SmartPM generally recommends:
These benchmarks should not replace project-specific judgment, but they provide a useful starting point for schedule review.
For teams trying to understand how float fits into broader project duration planning, SmartPM’s guide to construction timelines provides additional context.
Instead of relying on float as a buffer, many teams prefer structured contingency.
Float is shared and uncontrolled. Contingency can be allocated, tracked, and governed.
Treating float as contingency reduces transparency and weakens decision-making.
Contingency planning may involve:
However, float should not be used as a substitute for contingency.
Float is a shared schedule resource that is consumed automatically. Contingency, on the other hand, is intentionally planned and allocated. Separating contingency from float improves transparency, accountability, and control over schedule risk.
This distinction is especially important when performing construction schedule risk analysis, where teams need to understand not only where float exists, but how likely it is to be consumed.
One of the most valuable uses of float is tracking erosion over time.
When float decreases across updates, it indicates schedule stress even if the finish date has not moved. This is often the earliest signal that the project is drifting away from its planned completion date.
For example, a project may still show the same final completion date across three monthly updates. On the surface, the project appears stable. But if near-critical activities are multiplying and total float is steadily declining, the project is losing flexibility.
Float erosion can reveal:
This is why float should not only be reviewed as a static value. It should be trended.
A single schedule update tells you where float stands today. Float trend analysis tells you whether the project is becoming healthier or riskier over time.
Float is useful, but only when teams understand what it does and does not mean. The most common mistakes include:
High float does not automatically mean an activity is low risk. It may mean the activity is flexible, or it may mean the schedule is missing logic.
Before deprioritizing high-float work, ask whether the float is real.
Total float tells you when the project finish date is affected. Free float tells you when the next activity is affected.
An activity can have total float and still have zero free float. That means a delay may not move the final completion date, but it can still disrupt the next trade.
Constraints can make a schedule appear stable while hiding the true driving path. If constraints are forcing dates, float may not reflect real schedule flexibility.
Review constrained activities carefully before trusting float values.
Missing predecessors and successors inflate float. A schedule with excessive high-float activities may not be showing real flexibility. It may be showing incomplete sequencing.
Schedule logic must be reviewed before float can be trusted.
Float is shared schedule capacity. Contingency is planned risk allowance.
Using float as contingency creates confusion because float can be consumed by multiple activities without clear ownership or approval.
The critical path matters, but near-critical paths often become tomorrow’s critical path.
If the team only watches zero-float activities, it may miss the paths that are quietly losing flexibility.
Float is most powerful when trended across schedule updates. A single float value is a snapshot. Float erosion is a signal.
Project controls teams should monitor whether float is increasing, decreasing, or being distorted by logic changes.
Float is only as valuable as the CPM schedule that produces it.
That means schedules must be built with best practices and those best practices must be maintained throughout the updating process. Number one, ensure you have high schedule quality.
Several DCMA schedule quality checks are associated with float, including:
Schedule quality control ensures schedules are built with best practices, allowing project teams to trust what their schedules are telling them.
When float values are accurate, teams can make better decisions about resources, sequencing, trade coordination, recovery planning, and risk. When float values are distorted, the team may be making critical decisions based on bad information.
That is where SmartPM helps.
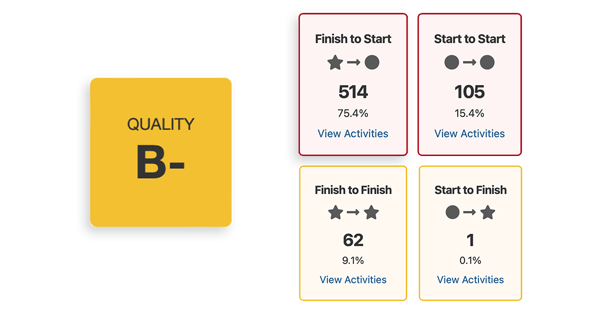
SmartPM’s schedule quality analytics automatically identify float-related issues, missing logic, high-float activities, near-critical paths, float erosion, and other schedule risk indicators. Instead of manually searching for problems across every update, project controls teams can see where schedule confidence is improving, where it is deteriorating, and where action is needed.
Float should not be treated as slack to waste. It should be treated as a measurable indicator of schedule risk.