
Schedule Performance Index (SPI): Formula, Example, and Interpretation
SPI is invaluable for honing predictability. At its core, SPI represents the productivity rate of a project.
Blog
Keeping track of key performance indicators (KPIs) helps teams stay ahead of delays, control costs, and reduce risk before small issues turn into major setbacks.

No construction project starts without a plan, or a way to measure if that plan is working. It’s impossible to start building with unlimited time and money; if general contractors don’t watch the budget, overruns can quickly escalate. If developers neglect the financial risk, profit margins may shrink.
In order to maintain profitability, projects need measurable metrics that can track progress and flag potential issues early on. Key performance indicators in construction fill this role by ensuring project managers have visibility into scheduling, spending, and overall quality. Along with enhanced project management, these indicators support stronger financial health and more accurate reporting.
This guide explains why these metrics matter and how they can protect the bottom line. The math is simple: tracking the right numbers can elevate each construction project’s success.
Construction KPIs are measurable benchmarks that show how well a project is performing across schedule, cost, safety, quality, and stakeholder outcomes. They help project teams compare planned performance against actual conditions so they can identify risk early and make better decisions before delays or overruns escalate.
Construction KPIs help teams:
|
KPI |
What It Measures |
Why It Matters |
|
Profit Margin |
Profit retained after project costs and expenses |
Shows whether the project or business is financially viable |
|
Cash Flow |
Cash coming in and going out during the project |
Helps prevent payment delays, funding gaps, and work stoppages |
|
Working Capital |
Current assets minus current liabilities |
Shows whether the company can cover short-term obligations |
|
Cost Variance |
Difference between earned value and actual cost |
Flags whether the project is under or over budget |
|
Project Progress |
Completed work compared to the planned timeline |
Shows whether the project is advancing as expected |
|
Cost Performance Index (CPI) |
Cost efficiency relative to work performed |
Reveals whether spending is aligned with earned value |
|
Schedule Performance Index (SPI) |
Schedule efficiency relative to planned work |
Shows whether progress is ahead of or behind plan |
|
Rework |
Work that must be redone due to errors or defects |
Highlights quality issues that increase cost and compress schedules |
|
Change Orders |
Modifications to the original contract scope |
Shows scope movement, budget impact, and schedule risk |
|
Incident Rate |
Recordable safety incidents on the job site |
Helps reduce liability, downtime, and worker risk |
|
Labor Downtime |
Lost labor hours due to stoppages or safety issues |
Shows productivity loss and schedule impact |
|
Client Satisfaction |
Client perception of quality, communication, and delivery |
Supports trust, repeat business, and stronger stakeholder relationships |
Construction industry KPIs represent specific metrics or benchmarks that gauge how well an operation is performing within areas such as scheduling, cost control, safety, and quality. They provide an objective view of job site effectiveness, enabling continuous improvements and more predictable outcomes.
Using reliable metrics and benchmarks ensures that teams can compare actual conditions against planned targets. For instance, if schedule performance starts slipping, corrective measures can be taken immediately. Tracking KPIs can also reveal patterns. Gauging cost variance over time, for example, can indicate whether the bottom line is secure or at risk.
Key benefits of KPIs in construction include:
Data-driven insights let stakeholders see how a construction project is progressing according to the plan. From daily tasks to weekly performance trends, transparent numbers help decision-makers detect issues as soon as they surface.
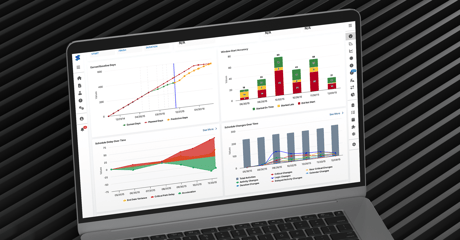
Forward-looking schedule insights built from those same KPIs let teams see where a project is heading, not just where it stands today. That turns weekly metrics into an early warning system for end-date risk.
The plan itself sets the ceiling on how useful those insights can be, which is why mature teams spend real time on early planning and scoping before they worry about the reporting layer.
Change orders, resource shortfalls, or unforeseen scheduling bottlenecks often extend projects past the plan. By monitoring real-time indicators, teams can anticipate cost overruns or potential delays before they escalate.
Consistent KPI measurement increases efficiency, reduces rework, and boosts client satisfaction. Proactive attention to key metrics ultimately leads to more reliable results and stronger relationships with investors, owners, and other stakeholders.
Sharing schedule insights with stakeholders regularly turns KPI data into a conversation, not just a number on a dashboard.
Essential construction KPIs turn project oversight into a proactive process rather than a reactive one. Without clear metrics, teams rely on gut instinct and assumptions, which can lead to missed deadlines, cost overruns, and inefficiencies that only surface when it’s too late to fix them.
Pulling those KPIs into construction project controls is what turns scattered metrics into a single signal of where the project is actually headed, instead of leaving each department to interpret its own numbers.
By tracking KPIs throughout a project, construction businesses gain early visibility into potential issues. Whether it’s a slipping schedule, rising costs, frequent change orders, or safety concerns, the right metrics highlight problems before they spiral.
Consistent KPI tracking is essential because it helps teams:

Construction KPIs usually fall into a few core categories: financial performance, project management, safety, and customer satisfaction. Each category gives project teams a different view of project health.
The most useful KPI programs do not track every available metric. They focus on the indicators that connect directly to cost, schedule, risk, and stakeholder expectations. A contractor may track dozens of data points across the business, but the KPIs that matter most are the ones that help teams make faster decisions while there is still time to act.
Financial KPIs show whether a project is protecting the bottom line or putting margin at risk. They are especially important because even a project that looks on schedule can still create financial strain if costs, billing, or cash flow are not being managed closely.
Common financial KPIs include:
Financial KPIs help project managers, executives, and finance teams stay aligned. When teams can see where costs are rising or cash flow is tightening, they can adjust faster and avoid surprises late in the project.
Project management KPIs show whether the work is progressing according to plan. These metrics are critical because schedule delays, coordination issues, and productivity gaps often create a ripple effect across the entire job.
Important project management KPIs include:
These KPIs help teams move from reactive project management to proactive project controls. For example, if SPI begins trending below target, teams can investigate schedule drivers before a delay becomes unrecoverable.
For teams looking to connect these indicators to schedule risk, construction schedule analytics can help turn KPI signals into forward-looking insight.
Safety KPIs measure how well a project is protecting workers, reducing incidents, and limiting job site risk. A strong safety record does more than protect people. It also reduces downtime, liability, insurance exposure, and schedule disruption.
Common safety KPIs include:
Safety KPIs should be monitored consistently, not only after an incident occurs. Near misses, for example, can be an early warning signal. If teams see the same type of near miss happening repeatedly, they can correct the issue before it leads to an injury.
Customer satisfaction KPIs show how owners, developers, and other stakeholders view project performance. These metrics are sometimes overlooked because they are less technical than cost or schedule indicators, but they are still tied directly to repeat business and long-term growth.
Useful customer satisfaction KPIs include:
A project can hit many technical benchmarks and still damage trust if communication is poor. Tracking customer satisfaction helps teams identify friction early and maintain stronger relationships with owners and stakeholders.
KPI formulas give construction teams a consistent way to measure performance across projects. The goal is not to make reporting more complicated. The goal is to create a shared language so project managers, executives, owners, and trade partners can understand what the numbers mean.
Here are several construction KPI formulas worth tracking:
|
KPI |
Formula |
When to Use It |
|
Profit Margin |
(Revenue - Costs) / Revenue x 100 |
Use to understand how much revenue is retained as profit after project costs. |
|
Working Capital |
Current Assets - Current Liabilities |
Use to evaluate short-term financial health and liquidity. |
|
Cost Variance |
Earned Value - Actual Cost |
Use to see whether the project is under or over budget. |
|
Schedule Variance |
Earned Value - Planned Value |
Use to compare completed work against planned progress. |
|
Cost Performance Index |
Earned Value / Actual Cost |
Use to measure cost efficiency. A CPI below 1.0 means the project is over budget for the value earned. |
|
Schedule Performance Index |
Earned Value / Planned Value |
Use to measure schedule efficiency. An SPI below 1.0 means the project is behind schedule. |
|
Incident Rate |
(Number of Recordable Incidents x 200,000) / Total Hours Worked |
Use to compare safety performance across projects or reporting periods. |
|
Rework Rate |
Cost of Rework / Total Project Cost x 100 |
Use to understand how much rework is affecting cost and productivity. |
|
Change Order Rate |
Number of Change Orders / Total Contract Items or Project Milestones |
Use to monitor scope movement and project disruption. |
These formulas are most valuable when they are tracked over time. A single CPI or SPI reading can be useful, but trends are what tell the real story. If schedule performance declines for several reporting periods in a row, the team should investigate the activities, logic, constraints, or resource issues driving that movement.
For readers who want to connect KPI formulas to schedule risk and project forecasting, construction project controls provide the framework for turning those numbers into proactive decisions.
KPIs work best when they are built into the project process from the beginning. Waiting until the project is already in trouble limits the value of the data because there is less time to correct the issue.
To implement KPIs effectively, project teams should start with a clear plan:
Start by identifying what success looks like. Is the priority schedule certainty, margin protection, safety performance, owner satisfaction, or all of the above? The KPIs should connect directly to those goals.
For example, if the project has a tight completion date, schedule-focused KPIs like SPI, project progress, critical path movement, and schedule variance should be monitored closely.
Different types of construction schedules can also shape how teams define planned timelines, measure progress, and set expectations from the start.
Not every metric deserves a spot on the dashboard. Too many KPIs can create noise and make it harder to see what actually matters.
Focus on KPIs that are:
KPIs need context. A number by itself does not always tell the team whether performance is good, bad, improving, or getting worse.
Benchmarks can come from:
Once benchmarks are defined, teams can compare actual performance against the plan and identify variance earlier. When stakeholders need a visual view of project progress, a construction Gantt chart can help compare planned vs. actual timelines alongside KPI trends.
Every KPI should have a clear owner. If no one is responsible for tracking, reviewing, and acting on the metric, the data can quickly become a reporting exercise instead of a management tool.
For example, finance may own cash flow and margin reporting, while project controls may own schedule variance, SPI, and critical path performance. Safety teams may own incident rate and near-miss reporting.
KPI tracking should be part of the project rhythm. Weekly and monthly reviews help teams identify trends, discuss corrective actions, and communicate risk before it escalates.
The review cadence should match the pace of the project. A fast-moving project may need more frequent schedule and field productivity reviews, while executive reporting may happen monthly.
Using construction scheduling software can make these reviews easier by keeping dashboards and real-time tracking tied to schedule updates.
For teams focused on identifying risk before delays escalate, schedule delay analysis can help explain what is driving the variance and where corrective action should start.
Tracking KPIs is not just about collecting data. It is about creating a process that turns project information into better decisions.
Here are several best practices for making construction KPI tracking more effective:
A dashboard with too many metrics can make it harder to see what needs attention. Start with the KPIs that connect most directly to cost, schedule, safety, and stakeholder outcomes.
A focused KPI set helps teams spend less time sorting through data and more time acting on the signals that matter.
KPI reporting is only as good as the data behind it. If schedule updates, cost reports, safety logs, and field reports are inconsistent, the dashboard may create confusion instead of clarity.
Use consistent inputs, update schedules regularly, and make sure teams understand how each KPI is calculated.
A single report can show where the project stands today. Trend data shows where the project is heading.
For example, one week of cost variance may not be alarming. But if cost variance continues to worsen over several reporting cycles, the team needs to investigate the root cause.
A KPI should trigger a conversation, decision, or corrective step. If the metric does not help the team act, it may not be worth tracking.
For example:
Owners, executives, and project teams may not interpret the same data in the same way. Clear reporting helps everyone understand what is happening, why it matters, and what action is being taken.
Good KPI reporting should include:
Sharing KPI insights with stakeholders regularly turns project data into a conversation. It also builds trust because owners and executives can see how the team is identifying risk and responding to it.
Strong construction reporting makes that visibility easier by giving owners, executives, and project teams a clearer view of performance, risk, and next steps.
For readers who want to go deeper, these SmartPM resources are natural next steps: