
Float in CPM Schedules: Total Float, Free Float, and Why It Matters
In essence, float can offer a buffer against unexpected changes, allowing activities to be postponed without impacting the overall end date.

Blog

Schedule variance measures the gap between where a construction project's schedule says work should be and where the project schedule data shows it actually is.
A positive schedule variance percentage means work is ahead of schedule against the baseline pace; a negative number means the entire project is running behind. That single figure gives project managers a fast, numeric answer to a question that used to depend on gut feel: is this project on track?
But schedule variance was built for cost-based reporting, not for reading a CPM schedule. A project can show a healthy, positive schedule variance while its critical path is quietly slipping underneath it. Understanding where the number stops telling the full story matters more on a construction project than in most other settings.
The schedule variance formula compares the value of work performed against work scheduled, expressed in the same unit as the project budget. AACE International's Recommended Practice on variance analysis defines the calculation the same way most EVM practitioners use in practice.
SV = EV − PV
Where:
This differs from cost variance, which compares earned value against actual cost incurred rather than planned value. Schedule variance stays focused on timing, not spend. If EV is higher than PV, schedule variance is positive, and the team has completed more work than planned. If EV is lower than PV, schedule variance is negative, and the project is behind. If EV equals PV, schedule variance is zero, meaning the project is exactly on pace.
A project has a total budget of $2,000,000 and an agreed-upon schedule of 200 days. At day 100, the plan called for $1,000,000 complete (PV). The team has actually completed $850,000 (EV).
SV = $850,000 − $1,000,000 = -$150,000
To express this as a schedule variance percentage, divide SV by PV:
SV% = -$150,000 / $1,000,000 = -15%
The project is running 15% behind the baseline pace. That percentage is useful for communicating status, but it says nothing about which activities caused the gap or whether they sit on the critical path.
Schedule variance and the schedule performance index answer related but different questions. SV, or schedule variance, reports the size of the gap between planned and actual progress in dollars. SPI reports that same progress as a ratio, which makes it easier to compare performance across projects of different sizes.
|
Metric |
What It Measures |
Formula |
|
Schedule Variance (SV) |
Dollar-weighted gap between planned and actual progress |
EV − PV |
|
Schedule Performance Index (SPI) |
Schedule efficiency as a ratio |
EV / PV |
|
Cost Performance Index (CPI) |
Cost efficiency as a ratio |
EV / AC |
A deeper breakdown of that complete schedule performance indicator is available in SmartPM's guide to Schedule Performance Index.
Schedule variance was designed for programs where cost and schedule move together. Construction schedules do not always behave that way, because they run on logic ties, float, and a critical path, not just a percent-complete curve.
A project can show a flat or even positive cumulative schedule variance while the critical path itself is losing days every update. That gap shows up in a few common ways:
This is why schedule variance is important as a first signal, not a final verdict. The number that actually predicts the completion date is critical path delay, not the blended EVM figure. A project team watching SV percentage alone can be surprised by a slipping end date that the top-line number never flagged. Relying on schedule variance by itself, without checking the critical path behind it, is one of the most common mistakes teams make when tracking construction schedules.
Resource allocation runs into the same problem. If a team reallocates labor to chase a better schedule variance percentage by front-loading non-critical scope, resources move away from the sequence that actually needs them. The number improves. The finish date does not.
Negative schedule variance rarely comes from one cause. The table below covers patterns that show up most often, several of which overlap with the deficiencies GAO's Schedule Assessment Guide flags as common drivers of unreliable schedules.
|
Cause |
How It Shows Up |
|
Missing or weak logic ties |
Activities lack dependencies needed to reflect sequencing, so planned progress doesn't match reality |
|
Subcontractor or trade delays |
Actual work on a trade's activities falls behind baseline dates |
|
Resource shortages |
Labor or equipment shortfalls slow actual progress relative to work planned |
|
Weather and site conditions |
Lost days accumulate on weather-dependent activities, especially those with little float |
|
Overly optimistic baseline |
The original plan assumed durations or productivity the team couldn't sustain |
|
Scope changes and RFIs |
Added or revised work shifts the work breakdown structure after baseline, throwing off planned progress |
A single root cause rarely explains a whole project's variance. Most negative schedule variance is the accumulated effect of several factors compounding over time.
Project managers who track schedule variance well share a few habits in common, regardless of project size or delivery method.
Monthly reviews catch problems too late on fast-moving projects. Weekly or biweekly recalculation gives a team enough lead time to act.
A negative schedule variance percentage signals something is off. Critical path analysis shows what and where.
A calculation run against a poorly built baseline, with missing logic or unresolved constraints, will produce a number that looks precise and means very little.
A single bad week is normal. A cumulative variance that keeps growing more negative signals a systemic issue worth escalating. At S.M. Wilson, Director of Operations Kerry Lorts follows this same practice: when he notices a large variance from one schedule update to the next, he checks with the project director to determine the cause before it compounds.
General instructions to "work faster" rarely help. Actions aimed at the specific tasks driving the variance tend to actually move the number.
See a walkthrough of how SmartPM Essentials surfaces schedule variance and health for mid-market project teams new to schedule analytics.
Manual schedule variance calculations are slow and error-prone on a project with thousands of tasks. Most project management software wasn't built for CPM-based schedule variance at this scale. A construction schedule analytics platform recalculates SV, SPI, and cumulative schedule variance automatically with every update, tying those numbers to the activities and critical path movement driving them.
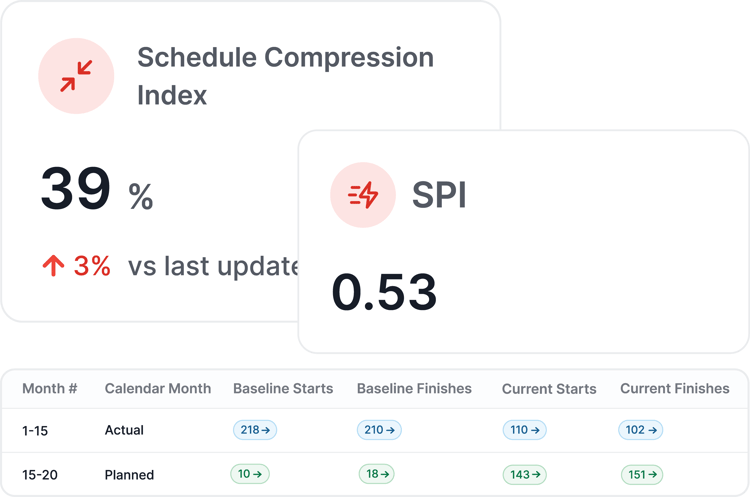
Pairing schedule variance with a proprietary CPM engine, one that recomputes the schedule from raw data instead of reformatting the scheduling tool's output, changes what the number can tell a team:
Teams that check in only monthly often discover problems after recovery options have narrowed. Consistent, automated tracking protects future performance by closing that gap.

Schedule variance gives project managers a fast way to communicate whether a project is ahead of schedule or behind it. Used alone, it can miss what's happening on the critical path. Paired with critical path analysis, schedule quality checks, and consistent tracking, it becomes part of a much clearer picture of project performance.
Book a demo to see how SmartPM's schedule analytics platform tracks schedule variance, critical path delay, and schedule health together on every project in your portfolio.