

Why a Project Health Index Matters in Construction
Key Takeaway:A strong project health index gives owners, developers, and executives the visibility they need to manage schedules, budgets, and risks with...

Blog
Similar to a report card gauging a student’s progress during the school year, project health gauges how well a project is doing against set standards.

Calculating the health of a project, regardless of industry, helps ensure the job is worth doing and is done well. However, what about commercial construction projects specifically? Enter the construction project health index. Similar to a report card gauging a student’s progress during the school year, project health gauges how much confidence you should have in the project’s planned end date based on objective schedule signals.
According to indeed.com, project health is simply a project’s overall functionality and progress towards successful completion. Of course, this includes factors such as financial success, employee productivity, ability to meet deadlines, and budgeting, among other factors.
Construction project health is the same. For the same reason, it measures how effectively a project is advancing towards its set objectives. Thus, a project is healthy if it meets several key performance indicators:
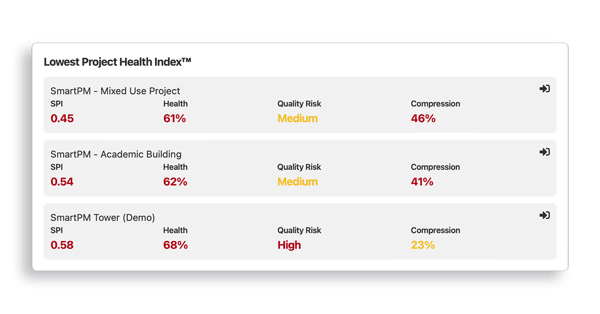
In construction, project health is less about general performance and more about confidence in the finish date. A schedule can absorb delay, consume float, and build compression without the end date moving. Rolling those signals up gives leadership early warning across a portfolio, flagging which jobs are quietly absorbing risk while their finish dates still look fine.
Project health metrics help determine whether that date is still realistic — or simply hasn’t caught up to execution risk yet.
When a project concludes, its health is often evaluated based on these standards. As The Project Management Institute (PMI) points out, questions like, “Will the project finish on time?” or “Will we stay within the budget?” are brought up often during the project lifecycle. To address these valid concerns, understanding your project’s health is crucial.
Your Project Health Index effectively guides your focus and efforts. At SmartPM, we calculate Project Health using several metrics, but the three main ones are schedule quality, schedule performance index, and compression. To calculate it, you need to weigh different schedule metrics at different times.

Schedule quality analysis is the foundation for diagnosing your project’s overall health. Once you establish a high-quality schedule, use it to assist with the following.
The DCMA 14-point assessment is a great place to start. It evaluates whether a schedule is well-built and whether it adheres to a set of best practices considered important to the success and manageability of a project.
PRO TIP: projects range in size, scope, and complexity. Consider implementing a custom grading metric specific to the best practices unique to your organization’s requirements.
Setting up grading metrics tailored to your projects early on means your team has an objective benchmark from day one, rather than relying on subjective judgment calls about whether a baseline is strong enough to trust.
Regarding project health, schedule quality is most important at the beginning of a project. Developing a high-quality baseline schedule is critical for prioritizing your resources throughout the project. Therefore, at SmartPM, schedule quality is weighed more heavily during the first 25% of your project than the other metrics. Because, without schedule quality, the end date may appear achievable even when the underlying logic makes it unrealistic. Quality ensures the schedule structure can actually support the completion date being shown.
Schedule Performance Index (SPI) compares planned versus actual progress in a metric that describes if you are ahead, behind, or on schedule. Once calculated, your SPI tells you the following.
For example, if your project is 50% complete today but, according to the schedule, you were supposed to be 75% complete, the SPI would be 0.66. As an SPI of 0.66 is less than one, you would know you are behind schedule. Armed with this knowledge, you can take action to get back on track or adjust your schedule to reflect more accurate durations based on historical performance.
When calculating project health, this metric should be weighed more heavily midway through the project than at the end. This is because, inevitably, as the project is near its endpoint, the SPI should equal 1. In essence, SPI doesn’t just tell you whether you are ahead or behind - it signals whether the probability of hitting the finish date is increasing or decreasing. A stable end date with declining SPI often means risk is building without the schedule reflecting it yet.
The Schedule Compression Index captures the amount of effort required to finish the project and compares it to the remaining work in the baseline. Be mindful: compression, often known as acceleration or trade stacking, can pose risks to your schedule. Without the necessary resources, your project might face delays.
Reading that index alongside the compression techniques behind it, crashing versus fast tracking, is what shows whether the added effort can still be absorbed or whether the end date is already gone.
Prioritize this metric in your project health index more towards the project’s end than its beginning. Compression arises when you use float, indicating a shortfall in the earned value. Despite this, compression indicates the end date is not relaxed. Sometimes, compression results from missing logic, meaning the schedule is prone to stacking when activities get pushed off. Or, compression results from critical path delays and changes to keep to an end date, where the schedule is overly stacked. Regardless, as projects get closer to the schedule’s supposed end date, the compression index tends to climb because the end date is not feasible.
Not every metric carries the same weight at every stage of a project. A compression index reading at month two means something very different than the same reading at month fourteen. SmartPM's Project Health Index accounts for this by shifting how much each metric contributes to the overall health score depending on where the project stands in its lifecycle.
These weightings aren’t just about performance - they reflect how confidence in the end date shifts over time. Early in a project, confidence comes from structure. Mid-project, it comes from performance. Late in the project, it comes from whether the remaining work can physically be completed in time.
Automated end-date forecasting turns those shifting weights into a projected completion date that reflects the current balance of quality, performance, and compression at any given point in the project.
Here's how the weighting breaks down:
|
Project Phase |
Schedule Quality |
Schedule Performance Index (SPI) |
Compression Index |
|
Early (0-25% complete) |
High |
Low |
Medium |
|
Mid (25-75% complete) |
Medium |
High |
Medium |
|
Late (75-100% complete) |
Low |
Medium |
High |
Early phase (0-25% complete): Schedule Quality carries the most weight
This is where the foundation gets set. A poorly built baseline schedule doesn't just affect week one - it creates problems that compound across the entire project lifecycle. Missing logic, excessive constraints, and long-duration activities are far easier to correct at the start than six months in. Getting the schedule right before work is underway is what gives every other metric something reliable to measure against. SPImeans very little at this stage because there isn't enough actual progress data to draw meaningful conclusions. However, compression carries a little weight here, as if you’re already crashing the schedule, your end date is at risk.
Mid phase (25-75% complete): SPI becomes the primary signal
Once the project is underway and real progress data is accumulating, SPI becomes the most telling indicator of where things stand. The gap between planned and actual completion starts to crystallize, and this is the window where course corrections are still feasible. A project at 40% completion running an SPI of 0.82 has time to adjust - but only if the signal is caught now. Compression begins to matter more here too, particularly if float has been consumed faster than planned — a sign that the end date may remain unchanged while risk is increasing.
Late phase (75-100% complete): Compression takes center stage
As the project approaches its scheduled completion date, the compression index becomes the most critical number to watch. Remaining work is getting stacked against a shrinking timeline, and the question shifts from "are we on track?" to "can we physically finish on time with the resources we have?" An index above 25% at this stage is a clear signal that the projected end date is at risk - and that crews may be facing overtime, trade stacking, or both to make it happen. At this stage, project health is no longer predicting performance — it is confirming whether the finish date is still physically achievable.
A workload feasibility assessment at each update shows whether the remaining effort is still achievable with the resources available, or whether the plan has quietly crossed into territory that crews cannot realistically deliver.
The key point here is that the finish date itself is a lagging indicator. Project health metrics (schedule quality, performance, and compression) are leading indicators. They tell you whether the end date is still realistic before the schedule is forced to move it.
Treating those leading indicators as the basis for decision-making is what construction project controls actually do, turning the schedule from a reporting artifact into the instrument that signals where the project is heading.

The goal of this analysis is not just performance tracking. Rather, it is understanding whether the scheduled completion date is still defensible. Once you have collected and analyzed data for your project’s health index, the next step is to interpret the findings and derive actionable insights. Here are some key considerations when analyzing project health index data:
Look for trends and patterns in the data to gain a deeper understanding of project performance. Are there recurring issues or bottlenecks? Are there certain tasks or phases that consistently face delays? Identifying these trends can help you focus on areas that need improvement.
Compare the actual performance of your project with the predetermined targets. Are you on track to meet your goals? Are there any significant deviations from the plan? This analysis will help you identify areas where adjustments or corrective actions are required.
Look for areas of improvement. Is there a particular process or trade that consistently underperforms? Are there any resource constraints to address? By identifying these areas, you can develop strategies to optimize project performance.
Take into account external factors that may impact project performance. These could include bad weather, supply chain disruptions, or inadequate resources. Considering these factors, you can make informed decisions and adapt your project strategy accordingly.
Share the findings of your project health index analysis with key stakeholders. This will help align expectations, gain support for necessary schedule changes, and ensure effective collaboration throughout the project.
By analyzing and interpreting project health index data, you can gain valuable insights into project performance, identify areas of improvement, and take proactive measures to ensure project success.
The insights derived from your project’s health index are only valuable if acted upon. Once you have analyzed the data and identified areas of improvement, it’s essential to implement changes based on the findings. Here are some steps to follow.
Create a detailed action plan that outlines the specific changes and improvements needed in your project schedule. Prioritize the actions based on their impact and feasibility. Assign responsibilities to team members and set clear deadlines for implementation.
Share the action plan with key stakeholders, including team members, executives, and clients. Then, clearly communicate the rationale behind the changes and the expected benefits. This will help gain support and ensure alignment of expectations.
Regularly monitor the progress of the implemented schedule changes. Collect new data and compare it with the previous project health assessment. This will help you evaluate the effectiveness of your schedule changes and make adjustments if necessary.
Use your project health index as a continuous improvement tool. Regularly review and update the index based on new insights and changing project dynamics. By continuously improving, you can ensure that your projects stay on track and deliver optimal outcomes.
Implementing necessary schedule changes based on your project health index findings is crucial for driving project success. By taking proactive measures to address areas of improvement, you can optimize project performance, reduce risks, and maximize project outcomes.
A project health index provides an objective signal of end date confidence for construction projects. Instead of relying on whether the finish date has moved, teams can see whether risk is building beneath the surface — allowing earlier, lower-cost course corrections.
Pulling those signals into a single project workspace makes the picture even clearer, since every schedule update, performance metric, and risk indicator for the project lives in one place rather than scattered across separate reports.
Don’t rely on guesswork or gut instincts – unlock the power of objective data with SmartPM’s automated project health index and take your projects to the next level. With our user-friendly interface, intuitive dashboard, and comprehensive set of components, SmartPM’s Project Health Index is a must-have tool for any project manager, analyst, or executive looking to drive project success through data-driven decision-making.
Tracking project health is only half the equation. The real question is what happens when teams don't track it - or track it too late to act.
The consequences show up in predictable ways:
Delays don't announce themselves. They build quietly - an activity slips, float gets consumed, compression starts climbing - and by the time the schedule reflects the problem, weeks of recovery cost have already accumulated.
Every day of delay on a construction project carries a real dollar cost in extended general conditions, labor overtime, equipment idle time, and subcontractor impacts. A project health index doesn't eliminate delays, but it surfaces the warning signs early enough to act before costs spiral.
When schedule health isn't tracked consistently across the project lifecycle, the data needed to support or defend a delay claim often doesn't exist. Which activities were truly critical at the time of the impact? What was the SPI trend in the weeks leading up to the delay event? Was compression already building before the change occurred? Without a continuous health record, those questions are answered by memory and opinion rather than data - and that's a difficult position to be in when a dispute reaches mediation or litigation.
When project teams don't have a reliable health signal, decisions get made on gut feel and status updates that may not reflect reality. Resources get allocated to activities that aren't actually driving the end date. Recovery plans get built on an SPI that looks acceptable on paper but masks underlying compression.
Owners get told the project is on track when the schedule data says otherwise. None of these outcomes are inevitable - but they become far more likely when health data isn't being monitored consistently.
A project health issue caught at 20% complete is a scheduling conversation. The same issue caught at 70% complete is a financial and contractual problem. The earlier the signal, the more options the team has - adjusting sequences, reallocating resources, resetting owner expectations, or negotiating scope. Waiting for the problem to become obvious in the field is the most expensive way to find out the schedule was in trouble.
None of these outcomes are surprises - they’re the predictable result of flying without objective health signals. When project health is tracked consistently, teams shift from reacting to problems to managing them early, when the fixes are smaller, cheaper, and far less disruptive.
Surfacing those signals in a company dashboard lets leadership see which projects are still trending toward on-time delivery and which are absorbing risk that hasn't yet shown up in the finish date.


