
Project Scheduler vs Scheduling Expert
A construction schedule is vital for planning, managing, and leveraging data analytics to make informed decisions.

Blog

SmartPM analyzed approximately 5,000 construction projects and found that forecast end-date slippage was cut in half after organizations adopted Project Intelligence, from 25% to 12.5% of planned duration. Published customer results show what that looks like in practice.

KCG Companies has a name for what end-date slippage costs them: “The Burn.” On an active project, it typically runs $400,000 to $800,000 a month.
Most contractors have a version of The Burn, even if they don’t call it that. General conditions keep running, crews and equipment stay committed, and the next job’s start date slides. On projects worth tens or hundreds of millions of dollars, a few months of slippage isn’t just a scheduling problem. It’s a business problem.
That’s the role of Project Intelligence: turning complex project data into insight teams can act on while there’s still time to change the outcome. But what is that intelligence actually worth?
Most ROI claims in construction technology come from a single project or an “up to” number. This is different. We followed the same customers from before they adopted SmartPM through years of use, across roughly 5,000 real projects, and measured the results from the schedules themselves. That kind of analysis takes years of schedule data at scale, and it’s the most complete picture we know of what Project Intelligence is actually worth.
We worked directly from SmartPM’s data warehouse, covering about 300 companies from 2019 to 2026, and compared the same customers before and after they started using SmartPM across roughly 5,000 projects. We focused on six measures: schedule quality, planned duration, actual duration, schedule performance index (SPI), schedule compression, and an overall project health score. Schedule compression measures how much work is pushed toward the end of a schedule, a common warning sign of a late finish.
To measure end-date slippage fairly, we took one reading per qualifying project (2,160 projects in total): its latest schedule update between 50% and 90% complete, comparing the forecast finish with the original committed finish. We cleaned future-dated records and extreme outliers, merged legacy accounts split across records, and reviewed medians alongside averages so a handful of extreme projects could not drive the result. This is an observational comparison of the same customers before and after adopting SmartPM, not a controlled study.
End-date slippage was cut in half. Across the projects analyzed, average forecast end-date slippage fell from 25.2% of original duration before SmartPM to 12.5%. In practical terms, a 24-month plan that used to be forecast to finish in about 30 months is now forecast to finish in about 27, roughly 10% sooner than the same companies’ projects before. The improvement wasn’t a perfectly straight line, with one six-month window ticking up before falling again, which is what real adoption looks like.
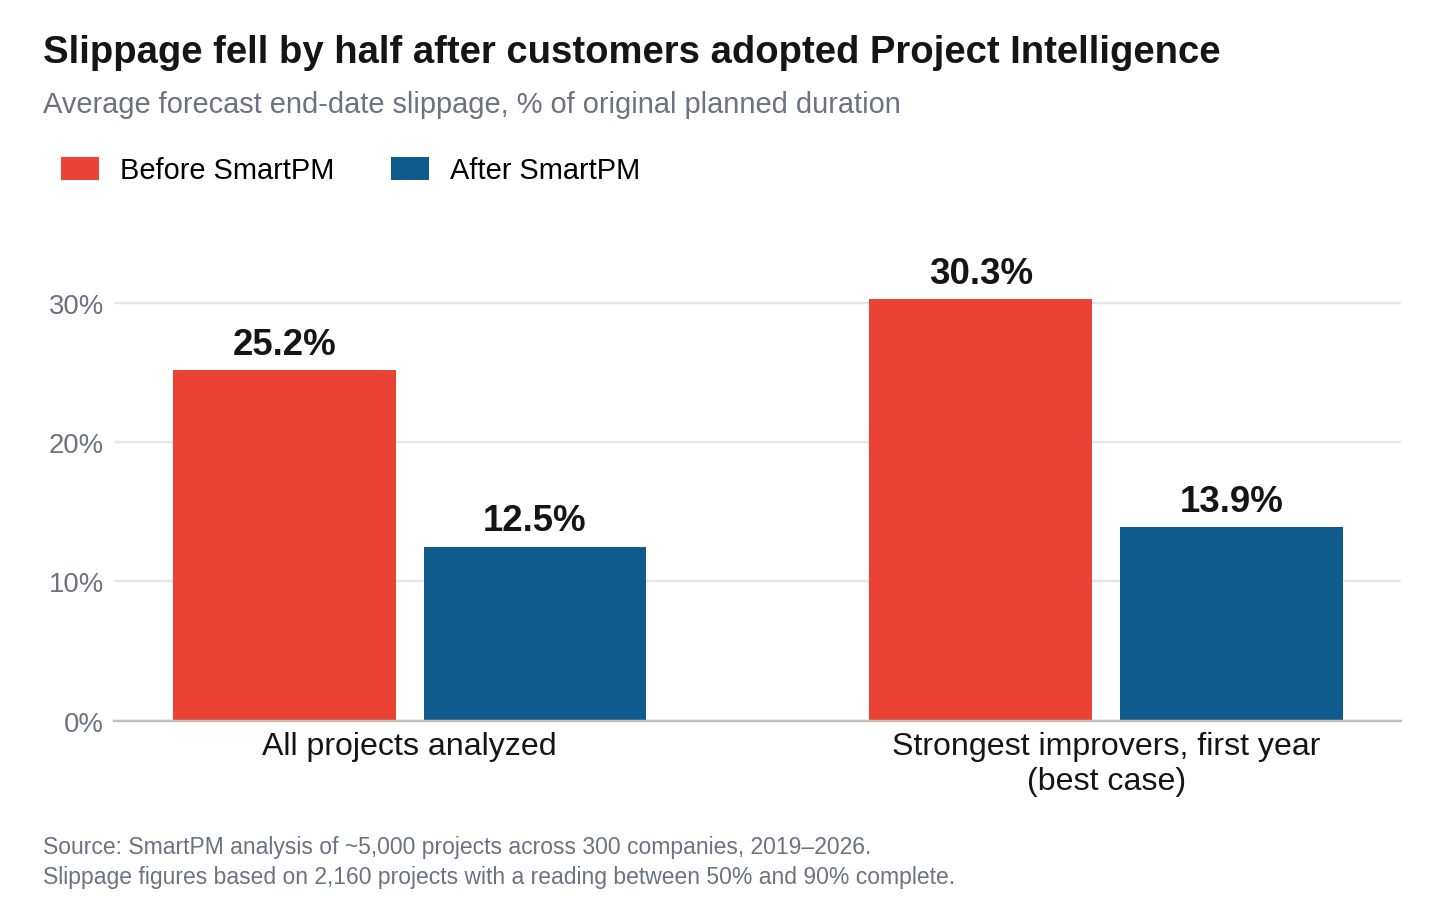
Our strongest improvers got there in a year. Among the 20 customers who improved most, the top 10 in each of our two largest customer tiers, slippage fell from 30.3% to 13.9% within their first year. That group is a best case by design, but it shows how quickly gains can come when a team commits.
The middle of the project is where it’s won or lost. The metric most closely tied to controlling end-date slippage was SPI between roughly 25% and 60% complete, along with keeping schedule compression in check over that same stretch. That’s the window where teams still have room to recover. SPI also tracked closely with schedule quality: projects built on sound logic surfaced problems while teams could still act.
Results compound with adoption. Companies did better the more projects they ran through Project Intelligence, and project volume mattered more than how long they had been a customer. Update cadence mattered too: projects updated weekly or biweekly performed better than those updated monthly or less often.
The bottom line from the data: Across the projects analyzed, forecast end-date slippage was cut in half and projects were tracking to finish about 10% sooner, with the biggest gains coming from what teams can control: schedule quality, update cadence, and acting early on SPI.
Published SmartPM case studies show the same pattern on real projects. They’re separate from the 5,000-project analysis, and they show how projects actually finished.
At MCP Group, the company reports it hasn’t missed a project completion deadline since implementing SmartPM. As CEO Pat Tolin put it, “Instead of being 2 months behind schedule, now we’re 2 months ahead of schedule.”
MCP Group case study
At Buckingham Companies, a nine-building development originally scheduled for 32 months was completed seven months early. On the next project of similar complexity, Buckingham shortened its target to 28 months and delivered in approximately 22.
Buckingham Companies case study
At Satterfield & Pontikes Construction, SmartPM identified more than 430 activities forecast to be completed in a single month, just three months before contractual completion. The team increased manpower and took corrective action, ultimately delivering the project on time.
Satterfield & Pontikes case study
At Garver, the impact extended across an entire program. In a 10-year, 32-project program, approximately 90% of projects finished on time or early. Garver also reports that accurate claims and better planning across multiple Arkansas DOT projects contributed to more than $50 million in savings.
Garver case study
Back to KCG. Before SmartPM, producing project analysis required more than 10 hours per project, which meant an update performed on Monday might not reach the site team until Thursday. With SmartPM, KCG reports receiving the analysis within an hour of an update. When The Burn runs $400,000 to $800,000 a month, those days matter.
KCG Companies case study
Other customers measure the value differently. Buckingham estimates roughly $400,000 in avoided costs per project from early completion, and MCP reports saving up to $125,000 per project. The numbers vary because the projects and business models vary. The principle doesn’t: when time has a cost, earlier visibility has economic value.
Consider a contractor managing 20 projects worth $50 million each, representing a $1 billion portfolio. If time-dependent project costs average $250,000 per month per project, improving project delivery by just one month across the portfolio would represent $5 million in potential avoided time-dependent costs. A two-month improvement would represent $10 million.
For an organization with costs closer to KCG’s Burn, the potential impact is substantially greater. Across just 10 projects, reducing end-date slippage by one month would represent $4 million to $8 million in potential avoided time-dependent costs.
That’s what makes the 5,000-project analysis particularly important. The data doesn’t show improvement on a single isolated project. It shows average end-date slippage declining as organizations manage more projects through SmartPM. The opportunity isn’t simply to improve one project. It’s to build a repeatable way of identifying risk and improving decision-making across an entire portfolio.
Shorter durations produce savings anyone can calculate: general conditions for the contractor and earlier revenue for the owner. But some of the most important returns don’t fit neatly into a spreadsheet.
More capacity from the team you already have. At Garver, schedulers who used to manage three or four projects now manage seven or eight without adding staff. Frampton Construction cut schedule reviews from more than two hours to about 10 minutes per project, and Rowan Digital Infrastructure turned a full-day report into a five-minute one. KCG replaced more than 40 hours a week of manual analysis across four active projects, and Joeris stopped paying outside scheduling consultants $400 to $500 an hour. That frees skilled people to act on the data instead of wrangling it.
A lower cost of doing business. Better documentation means fewer claims and less of the legal spend that comes with them. Home-office overhead falls because fewer projects need rescuing, and one job’s slippage stops spilling into the next job’s start date and staffing plan.
Stronger relationships and a real competitive edge. Owners trust contractors who can show, with data, exactly where a project stands. That trust turns into follow-on work, and a reputation for finishing on time becomes an advantage that’s hard to copy. It also makes for steadier, less stressful work for the people on the job.
None of these show up as a line item. Every one of them shows up in the business.
Three things the data says to do:
Watch SPI between 25% and 60% complete. That’s the stretch where a late finish is still preventable, and where compressed back-end work is easiest to spot.
Update weekly or biweekly. Projects updated monthly or less often performed worse. Slower updates mean slower signals.
Treat schedule quality as a leading indicator. Projects built on sound logic were the ones where problems surfaced in time to fix.
That’s the ROI of Project Intelligence: seeing risk earlier, acting sooner, and finishing closer to plan across an entire portfolio.
Want to know what your Burn is? Talk to our team about what Project Intelligence could be worth across your projects.
Book a demo.