
Construction Schedule Oversight and Data Analytics
Managing complex construction projects is daunting due to the overwhelming number of moving parts to track and coordinate.
Blog

Most general contractors do not decide to leave Excel behind. They get pushed out by the schedule itself. A construction project grows past a handful of jobs, updates start arriving weekly instead of monthly, and the spreadsheet that once tracked actual progress can no longer answer a basic question: Is this project on track to finish? That is the moment schedule analytics stops being optional and becomes the tool that keeps a construction company out of trouble.
This piece covers where Excel-based tracking breaks down, what this approach does differently, and how general contractors can tell when it is time to switch, without abandoning the scheduling tools already in place.
Excel is good at one thing: displaying whatever numbers get typed into it. For a single project with a small team, a tracker built around percent complete and milestone dates is often enough. The problem shows up as project schedules grow more complex.
A Critical Path Method (CPM) schedule is a network of thousands of tasks connected by logic and float. Excel has no concept of that network. It cannot recalculate the critical path when a task slips, cannot detect missing logic during an update, and cannot flag a constraint quietly added to hide a delay.
This holds true across commercial construction generally: a spreadsheet, purpose-built or not, can only reflect the data entered into it, not the logic that determines whether a plan still holds.
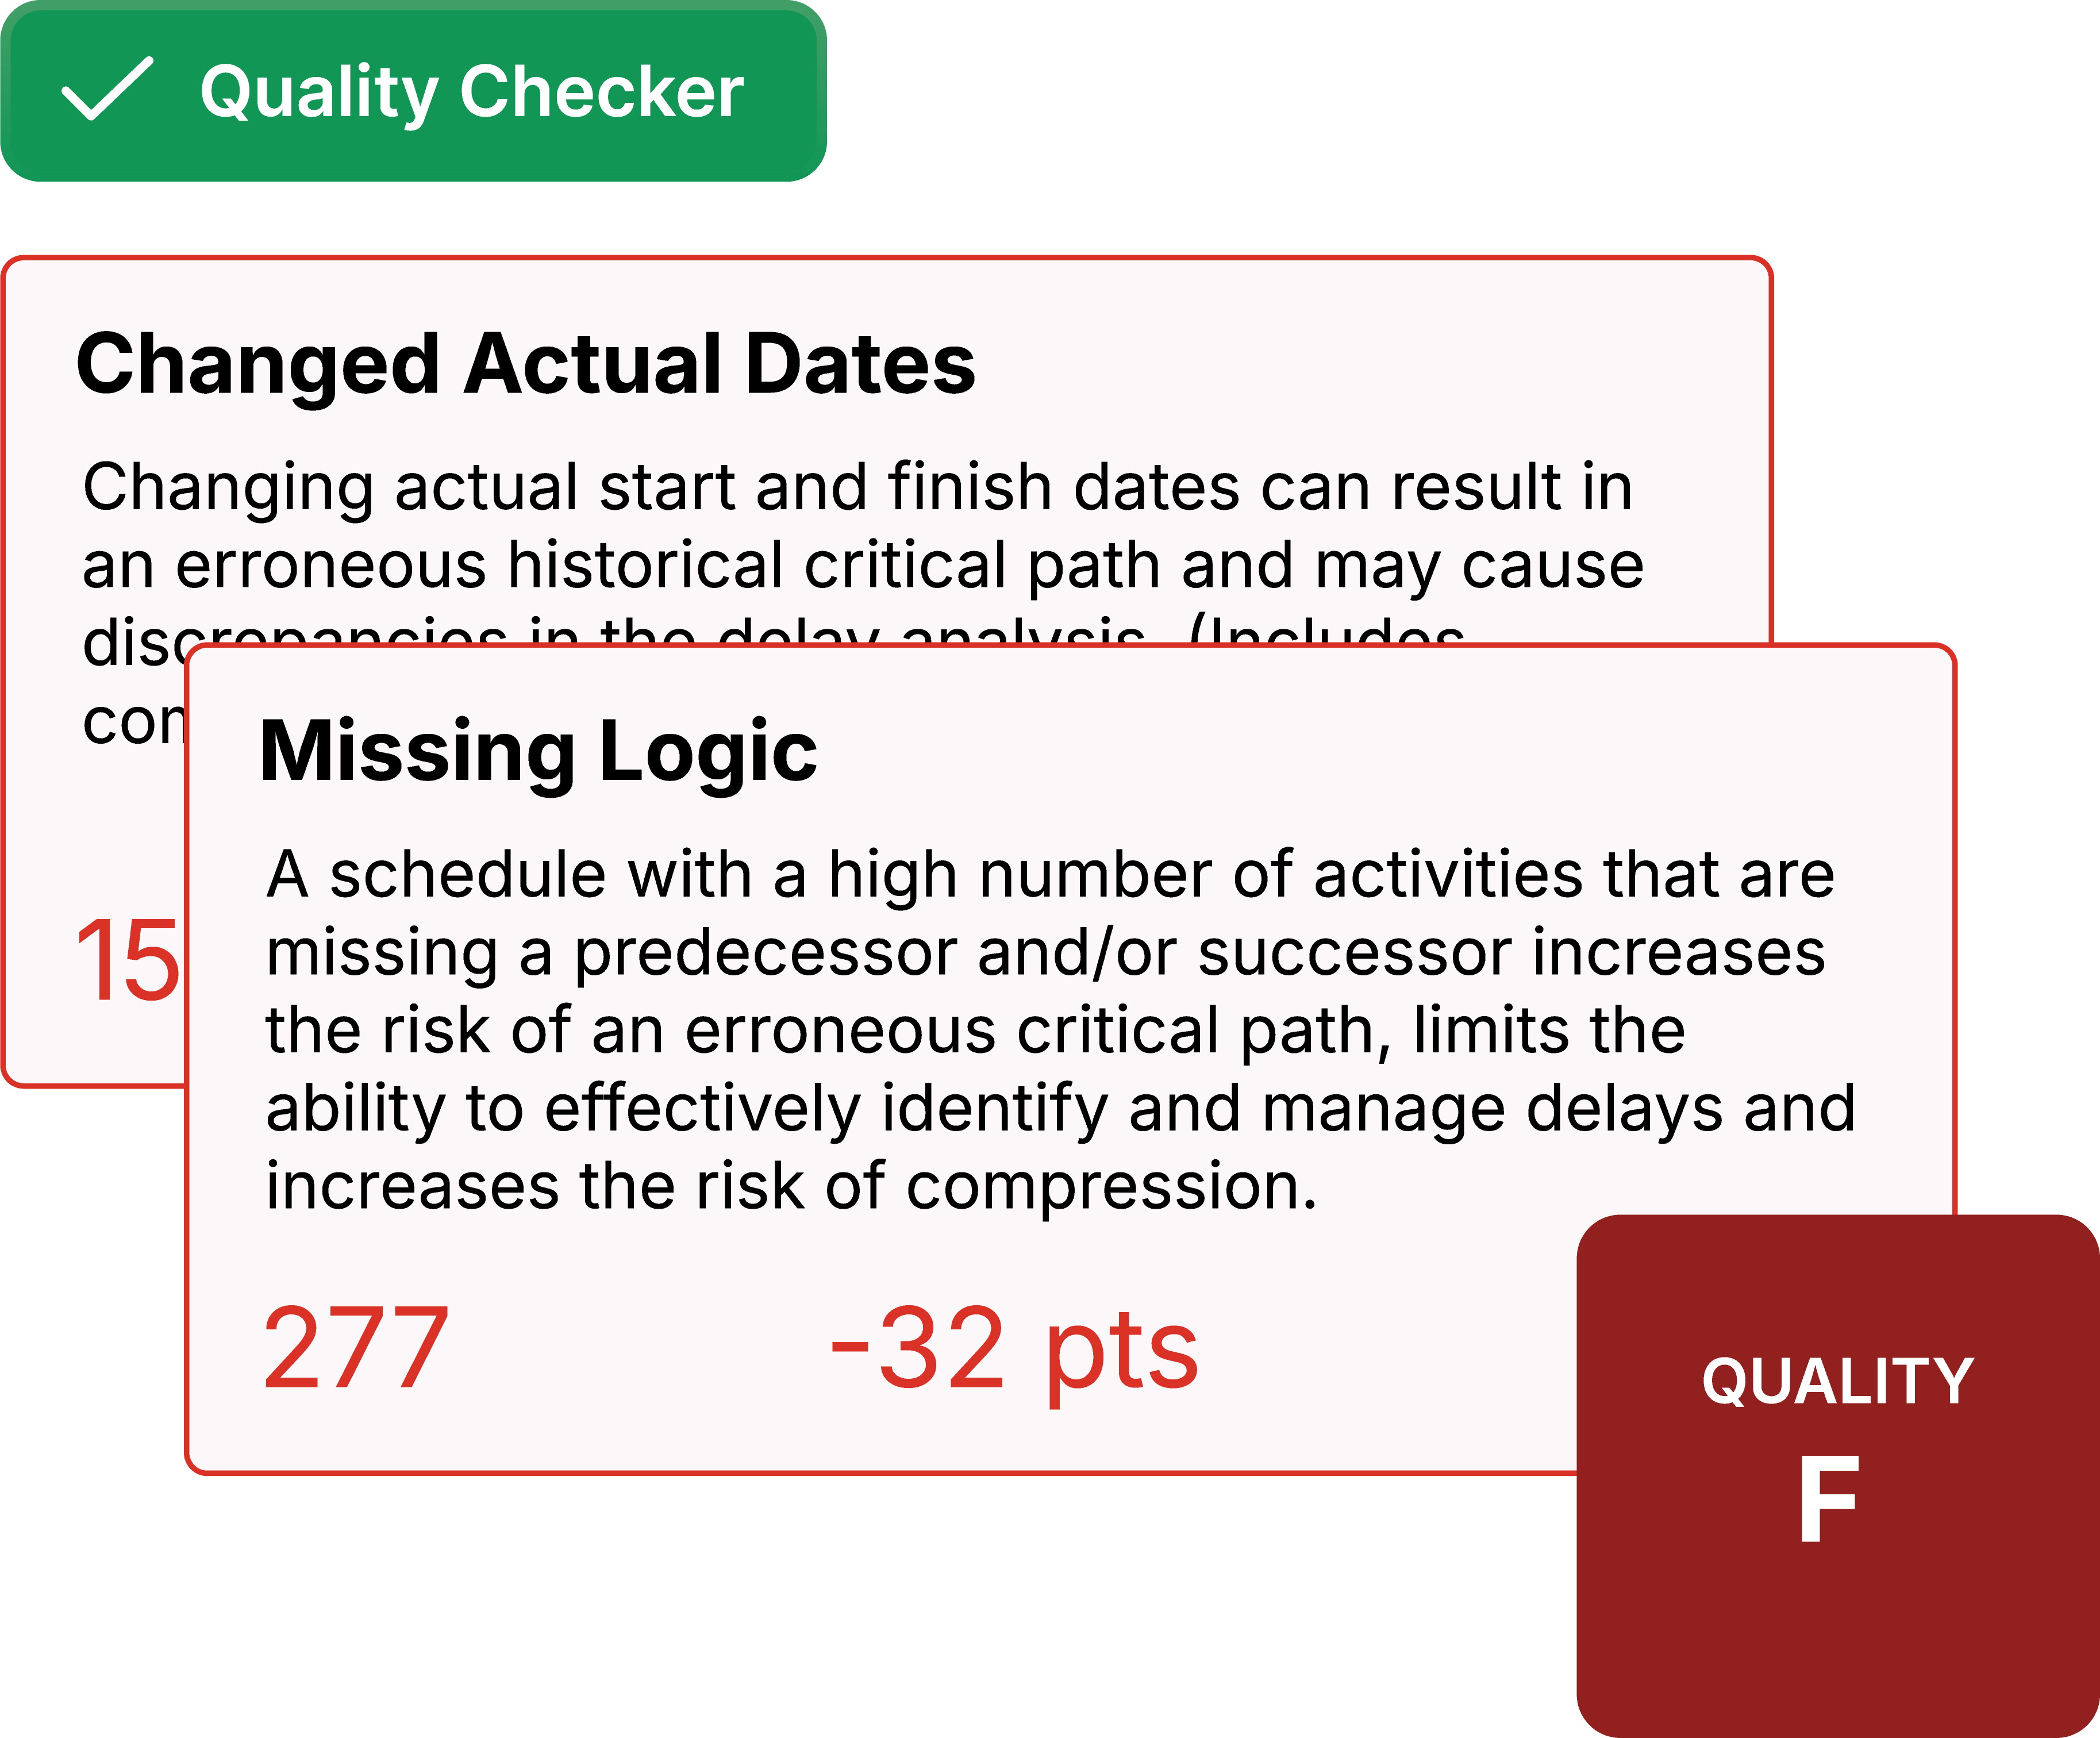
Excel cannot grade whether a schedule was built correctly, and it has no way to run the structural checks a real schedule analysis requires. A spreadsheet cannot:
A schedule can look complete in a spreadsheet, every task marked with a date, while the underlying logic is broken. Missing predecessors and out-of-sequence progress do not show up as red cells. They surface months later as a missed milestone nobody saw coming.
According to SmartPM's 2025 State of Construction Scheduling Report, only 12% of baseline schedules meet best-practice quality standards, and fewer than 5% maintain that quality through completion. Most of that erosion happens quietly, update by update, in exactly the environment where a spreadsheet is the only thing watching.
Staying on Excel past its usefulness costs construction companies in two places: time and risk.
|
Manual Tracking in Excel |
Construction Schedule Analytics |
|
|
Reporting time |
Days per project, per update cycle, spent pulling data and formatting reports by hand |
Runs automatically on every upload, freeing the project team to act on findings instead of building the report |
|
Delay detection |
Reactive; problems surface once they are large enough to notice manually |
Continuous; schedule logic is checked with every update, not just at reporting time |
|
Update cadence |
Usually monthly, since manual work does not scale with frequency |
Weekly monitoring becomes realistic once the analysis is automated |
|
What gets missed |
Cost overruns and slipped completion dates, since nobody is checking logic between cycles |
Delay accumulation is flagged early, before it threatens a milestone |
Those gaps rarely announce themselves. They build quietly, and a monthly cadence means decision makers and the construction managers closest to the work catch them weeks after the damage is done. At Frampton Construction, schedule reviews that used to take two hours or more now take about ten minutes, entirely from replacing manual comparison with an automated one.
See what your schedule data isn't telling you. Request a demo.
The core distinction: it performs mathematical operations on schedule data. A spreadsheet, or a general-purpose dashboard layered on top of one, only displays it. This is the same limitation general contractors run into with a visualization tool instead of a purpose-built one, as covered in Why Microsoft PowerBI Isn't Enough for Construction Schedule Analytics.
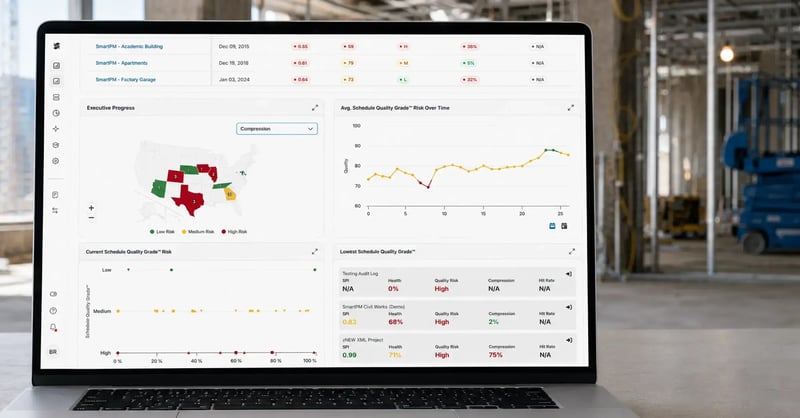
A CPM engine ingests a baseline and every subsequent update, then recalculates the schedule from raw data rather than reformatting whatever the scheduler exported. That recalculation produces a real schedule quality grade and a predictive project completion date grounded in actual progress and historical data, not the date typed into a cell.

A few concrete signals tend to appear before a construction company makes the switch:
None of these signs require a mature project controls function to notice. They just require a team to admit that the spreadsheet no longer tells the whole story. Industry bodies like AACE International publish scheduling practices built around this same kind of structured review, reinforcing that the shift reflects broader industry direction, not a single vendor's pitch.
Monte Carlo simulation addresses a different problem, probabilistic forecasting for complex federal programs, whereas day-to-day schedule quality monitoring is the more practical starting point for most general contractors.
A common hesitation is the assumption that adopting this approach means replacing the scheduling tool already in use. It does not. This is not a scheduling tool. It sits on top of Primavera P6, MS Project, Phoenix, or Procore and analyzes the data those systems already produce, whether the schedule was built in Microsoft Project or another CPM platform.
Here is what actually changes, and what does not.
Stays the same:
Changes:
Making the switch itself takes four steps:
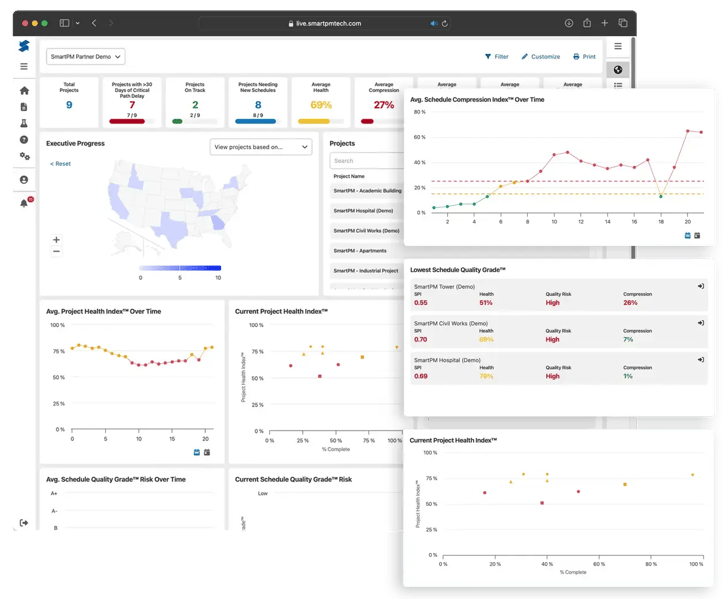
For a mid-market general contractor making this move for the first time, the entry point matters more than day-one feature depth. SmartPM Essentials is built for this stage: simplified, color-coded health indicators across unlimited projects, without the deep drill-down a dedicated project controls team would need.
As this practice matures and a team starts asking forensic questions about delay causation, SmartPM Controls provides fuller analytical depth. Starting with Essentials does not mean settling for less. It means a team new to the platform gets accurate, actionable insights immediately, improving project timelines and project performance without needing to build out a full project controls operation first.
Find the right starting point for your team. Book a demo.