

Schedule Forecasting Using Historical Data
Forecasting gives companies an early warning sign for potential end-date slippage.

Blog
SPI is invaluable for honing predictability. At its core, SPI represents the productivity rate of a project.

A common wish among many AEC professionals is predictability—a reaction to the industry’s general unpredictability. The market state, supply chain concerns, rising interest rates, and the skilled labor shortage are all long-standing and converging… making the construction industry seem amidst a “perfect storm.” In this landscape, adopting strategies and tools that provide transparency into schedule performance is critical for more predictable outcomes.
Schedule Performance Index (SPI) helps project teams measure that predictability more clearly. SPI compares the value of work completed, or Earned Value (EV), to the value of work that was planned to be completed, or Planned Value (PV). The formula is:
SPI = Earned Value (EV) ÷ Planned Value (PV)
An SPI greater than 1 means the project is ahead of schedule. An SPI equal to 1 means the project is on schedule. An SPI less than 1 means the project is behind schedule. In construction, that simple ratio can help teams spot delays early, communicate schedule health, and forecast completion dates more accurately.
In this landscape, adopting strategies and tools that provide transparency into schedule performance is critical for more predictable outcomes. The current environment is forcing many organizations to pause, pivot, and plan their upcoming project in more detail than ever before. One way to do so is with strategic, data-driven project management.
Effective management of construction projects requires accurate tracking and analysis of progress on-site. An essential metric for measuring project performance is your Schedule Performance Index (SPI). You can gain valuable insight into your project’s health by calculating SPI based on Earned Value Analysis (EVA). Additionally, utilizing these metrics allows you to predict end dates more effectively. Pairing SPI with predictive analytics takes that a step further by projecting where the end date is actually heading based on observed performance patterns, not just the planned curve.
Schedule Performance Index (SPI) measures schedule efficiency by comparing the value of work completed to the value of work planned. In construction, SPI helps teams understand whether the project is progressing ahead of schedule, on schedule, or behind schedule.
|
SPI Element |
What It Means |
Why It Matters in Construction |
|
Earned Value (EV) |
The budgeted value of work actually completed by a specific point in time. |
Shows how much progress has truly been earned based on completed work. |
|
Planned Value (PV) |
The budgeted value of work that should have been completed by that point. |
Establishes the planned progress benchmark for comparison. |
|
SPI Formula |
SPI = Earned Value (EV) ÷ Planned Value (PV). |
Converts schedule performance into a simple ratio that teams can track over time. |
|
SPI > 1 |
The project is ahead of schedule. |
Indicates work is being completed faster than planned. |
|
SPI = 1 |
The project is on schedule. |
Indicates actual progress matches planned progress. |
|
SPI < 1 |
The project is behind schedule. |
Signals that the team may need to investigate delays, constraints, or productivity issues. |
SPI is a performance metric that compares the actual progress of a project to the original plan. It gauges how far along the job is supposed to be versus how far along it is in reality. Simply put, it compares the value of work completed at any point in time (Earned Value, EV) to the value of work planned to be completed (Planned Value, PV). SPI reveals whether a project is ahead of schedule, on time, or running behind.
SPI is also part of Earned Value Management (EVM)—a comprehensive method used to track project performance and forecast future outcomes by combining cost, schedule, and scope data.
Before calculating SPI, it’s important to familiarize yourself with key terms associated with EVM and SPI:
Together, these terms form the foundation of SPI calculations and provide a comprehensive picture of project performance.
Schedule variance and SPI read those same two inputs differently, since SV reports the gap in dollars while SPI expresses it as a ratio that compares cleanly across projects of different sizes.
You can help monitor and control project progress by utilizing Earned Value Analysis (EVA) to identify deviations from the planned schedule. SPI is calculated by dividing the Earned Value (EV) by the Planned Value (PV).
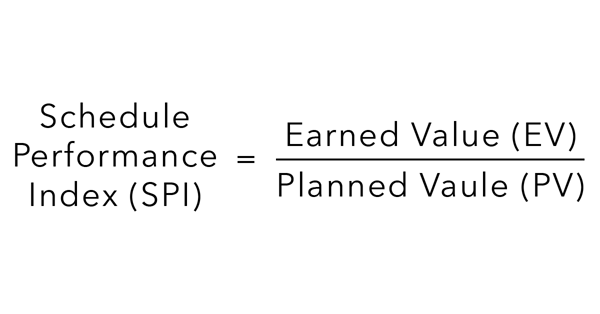
The SPI ratio quantifies the efficiency of work performed relative to the work accomplished. Once calculated, the ratio will tell you the following:
SPI is invaluable for those wishing for more predictability. At its core, your schedule performance index represents the productivity rate and schedule efficiency of a project.
For instance, a project was anticipated to reach 85% completion, but in reality, it reached only 72%. 
This gives the project an SPI of 0.85. An SPI of 0.85 means the project only achieves 85% of its planned productivity, indicating it’s behind schedule. If the SPI is consistently less than 1, as in this case, the remaining tasks will likely continue at the 85% productivity rate, potentially leading to an overrun.
To put it another way, if the productivity rate remains at 85%, a task projected to take 10 days would instead take approximately 12 days due to the reduced productivity.
With this understanding of SPI, stakeholders can make informed decisions. They might allocate more resources, reduce task durations, or adjust the project timeline. This ensures everyone involved has a clear picture of the expected project completion date.

For instance, a project was anticipated to reach 85% completion, but in reality, it reached only 72%.
In this example, the project has an SPI of 0.85.
An SPI of 0.85 means the project is progressing at 85% of the planned schedule efficiency and is behind schedule. If the SPI is consistently less than 1, as in this case, the remaining tasks will likely continue at the 85% productivity rate, potentially leading to an overrun.
To put it another way, if the productivity rate remains at 85%, a task projected to take 10 days would instead take approximately 12 days due to the reduced productivity.
With this understanding of SPI, stakeholders can make informed decisions. They might allocate more resources, reduce task durations, or adjust the project timeline. This ensures everyone involved has a clear picture of the expected project completion date.
SPI is invaluable for those wishing for more predictability. At its core, your schedule performance index represents the productivity rate and schedule efficiency of a project.
Here is how to interpret the result:
In construction, the interpretation matters because SPI connects schedule performance to productivity. A project with an SPI below 1 is not simply “late” in the abstract. It is producing work at a lower rate than planned, which can affect downstream activities, trade coordination, resource loading, and the projected completion date.
As shown in the example above, an SPI of 0.85 means the project is only achieving 85% of its planned productivity. If that trend continues, the project team should expect schedule pressure unless corrective action is taken.
SPI should not be a one-time calculation. Regular updates are critical to keeping a project on track. Ideally, SPI should be calculated at regular intervals, such as at key project milestones or in sync with schedule updates.
Construction teams should calculate SPI in sync with schedule updates, milestone reviews, and portfolio reporting cycles so the metric reflects current project conditions.
The frequency depends on:
By calculating SPI consistently, project teams can detect trends, anticipate delays, and maintain schedule integrity. Rolling those SPI trends up into a portfolio-wide view of schedule health lets leaders compare projects side by side and steer resources toward the ones slipping fastest.
By applying the historical productivity rate, represented by the SPI, to the remaining duration of the project, you can gain insight into a more accurate project completion date. SPI is most useful when viewed as a trend, not a one-time score.
Using past data and earned value metrics can help forecast project end dates, but adhering to specific guidelines in the process is essential.
Every activity needs to have accurate duration estimates on both critical and non-critical path activities. Adjusting the schedule based on actual performance rather than hopeful expectations yields the best results.
Before attempting to predict project outcomes, well-defined baseline schedules and their subsequent updates must be accurate. This is the only way to ensure that your reference point is valid enough to measure progress and calculate SPI throughout the project.
Continuously monitoring and tracking SPI throughout your project helps identify patterns and trends in schedule performance. By analyzing SPI values at different project milestones or periods, you can assess if the current project is consistently ahead or behind schedule.
Taking into account various project factors that can impact SPI, such as changes in scope, resource availability, weather conditions, and unforeseen events, helps assess the potential impact of these factors on future project performance.
You can predict future SPI values based on SPI trends throughout the project. For example, if the SPI has been consistently below 1, it indicates a likelihood of schedule delays. Conversely, if the SPI is consistently above 1, it suggests a potential for completing the project ahead of schedule.
By leveraging SPI alongside other schedule performance trends, project teams can make informed decisions about future project outcomes. This enables proactive decision-making, early identification of schedule risks, and effective mitigation strategies to keep the project on track.
SPI is a powerful metric, but only when it is calculated and interpreted correctly. Common mistakes include:
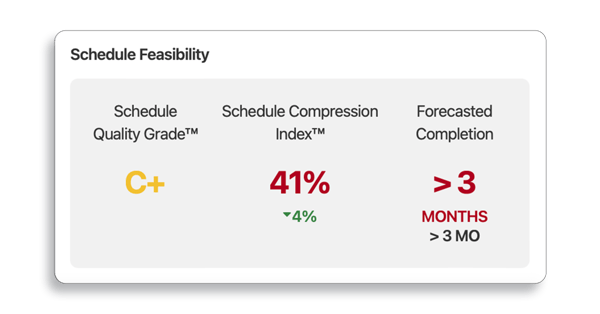
The drive towards improving predictability in the construction industry is not just a nice-to-have but an essential component to a project’s success. Enhanced predictability does more than just keep a project on track. It acts as a safeguard, reducing financial and safety risks while increasing stakeholder satisfaction. It also serves as a pivotal differentiator in a highly competitive market.

When construction firms like Mannon’s Manhattan Construction collaborate with advanced solutions such as SmartPM, they are not only tapping into cutting-edge technology but also fortifying their future. The success story of Manhattan and SmartPM showcases just how close we are to achieving impeccable precision, with a predicted end date nearly mirroring the actual completion.
It’s a testament to what’s possible when the right tools are in play.
To go deeper into construction schedule performance, planning, and analytics, explore these related SmartPM resources:
SPI is most valuable when project teams can calculate it consistently, monitor it across updates, and connect it to real schedule risk. Navigating a complex project requires the right tools and strategies to ensure success.
By mastering Schedule Performance Index, you can track progress with confidence, anticipate challenges, and keep projects on schedule.
To unlock the full potential of SPI and take your project management to the next level, explore solutions like SmartPM. Book a demo today and see how advanced analytics can enhance your schedule efficiency, mitigate risks, and maximize project performance.