

Strengthening Project Predictability with Schedule Performance Index (SPI)
SPI is invaluable for honing predictability. At its core, SPI represents the productivity rate of a project.

Blog
Forecasting gives companies an early warning sign for potential end-date slippage.

Schedule forecasting gives project teams an objective, data-driven view of when a project will actually finish, not when the schedule says it will. By leveraging historical performance data captured in the CPM schedule, teams can identify end-date slippage early enough to act on it.
Accurate forecasting depends on what comes before it. SmartPM has covered the full project controls foundation in depth, but the single prerequisite for any meaningful schedule forecast is a high-quality CPM schedule: activities properly linked, durations realistic, and progress updates applied consistently. A forecast built on a poorly maintained schedule will reflect the schedule's problems, not the project's actual conditions.
A schedule forecast is a data-driven prediction of future project conditions, including expected completion date and productivity trends, based on historical performance data captured in the CPM schedule. Unlike a static project plan, a forecast is updated continuously as new information becomes available.
Schedule forecasting uses historical performance data embedded in the CPM schedule to project future conditions. The core inputs are:
The more granular the schedule data, the more reliable the forecast. A schedule with well-defined activities, consistent update intervals, and accurate percent-complete data produces tighter forecasts than one maintained at a summary level.
Forecasting can be done manually, but the most practical approach for active projects is to automate it using Earned Value Analysis (EVA) metrics, extrapolating a future planned curve based on historical performance.
A full earned value analysis is not required to forecast. Only two metrics are needed; the planned value (PV) and earned value (EV):
Tracking earned value over time produces the SPI, which projects future performance assuming current productivity trends continue.
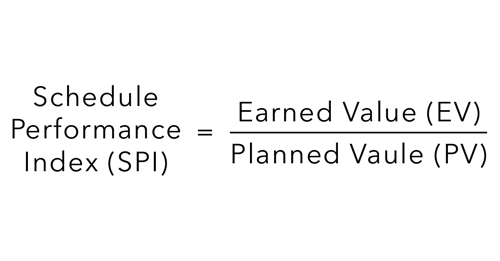
The Schedule Performance Index (SPI) is a ratio that measures how efficiently a project is progressing relative to its baseline plan. An SPI of 1.0 means the project is exactly on schedule. Below 1.0 means it is behind. Above 1.0 means it is ahead.
Using an earned value approach, SPI compares planned progress with earned progress to determine how closely you follow your baseline. A project’s SPI can be found by dividing its earned value by its planned value (EV/PV).
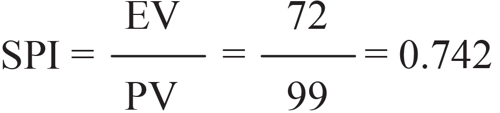
From there, the SPI’s ratio tells you where you are regarding progress. For this example, let’s say you conducted this analysis when you were 72% done with your project. However, you had originally planned to be 99% done at the current point in time.
Recall that:
Therefore, an SPI of 0.742 means that the project is achieving 74.2% productivity and is behind schedule. In other words, for every ten days of work, the project only earns 7.42 days of its planned work. So, if an activity has an original duration of 10 days, it will take 13.4 days to complete. This is because the production rate is slower than originally planned.
The SPI becomes a trustworthy measure of performance halfway through the project. By this stage, there is sufficient data to ensure that any anomalies have minimal impact on the SPI. Essentially, at different phases of a project, there are different activities with different parties responsible for the work being done. So, it would not be fair to use delays during the pre-construction phase to adjust the construction phase as the problems you encounter would be different.
Halfway through the job, or, in this case, 72% through the job, project teams can forecast how they will perform in the future. They do this by looking at the entire schedule and using historical information to predict the future. By looking at the SPI of approximately 0.742, you can expect the estimated duration remaining will be about 34% longer. This is because, historically, the project is consistently underperforming by about 34%.
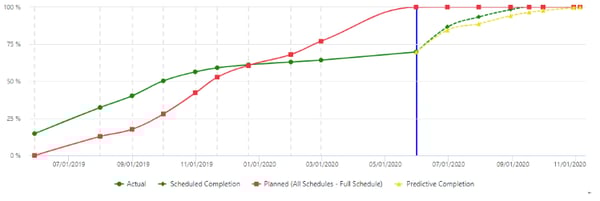
As depicted in the graph above, the project’s progress curve is extrapolated by using the SPI. The SPI adjusts the scheduled completion, shown by the yellow line. The yellow line is the schedule forecast. It predicts the project will be 100% completed about four months later than what the scheduled completion date is telling you and six months later than the baseline plan indicated.
Knowing this, decisions can be made to increase productivity (or manpower to accelerate), or the project will be delayed. If acceleration measures are met, the SPI will decrease, making the forecasted end date improve as a result of cured performance improvement.
Before pulling that trigger, teams can simulate acceleration options on a copy of the schedule to see whether the proposed changes actually move the end date or just shift the pressure to a different part of the critical path.
Forecasting gives project teams an early warning system for end-date slippage. The practical benefits include:
Automated project controls change how construction organizations operate by making this level of analysis available at scale. Through continuous CPM schedule analysis, the performance factors actually driving the end date become visible, project delivery becomes more predictable, and organizations of any size can operate with the analytical sophistication previously available only to the largest contractors.


