Construction Gantt Chart
Optimize Performance with a Smart Construction Gantt Chart
You’re in Good Company
What it Does
A Gantt Chart Built for Construction Projects
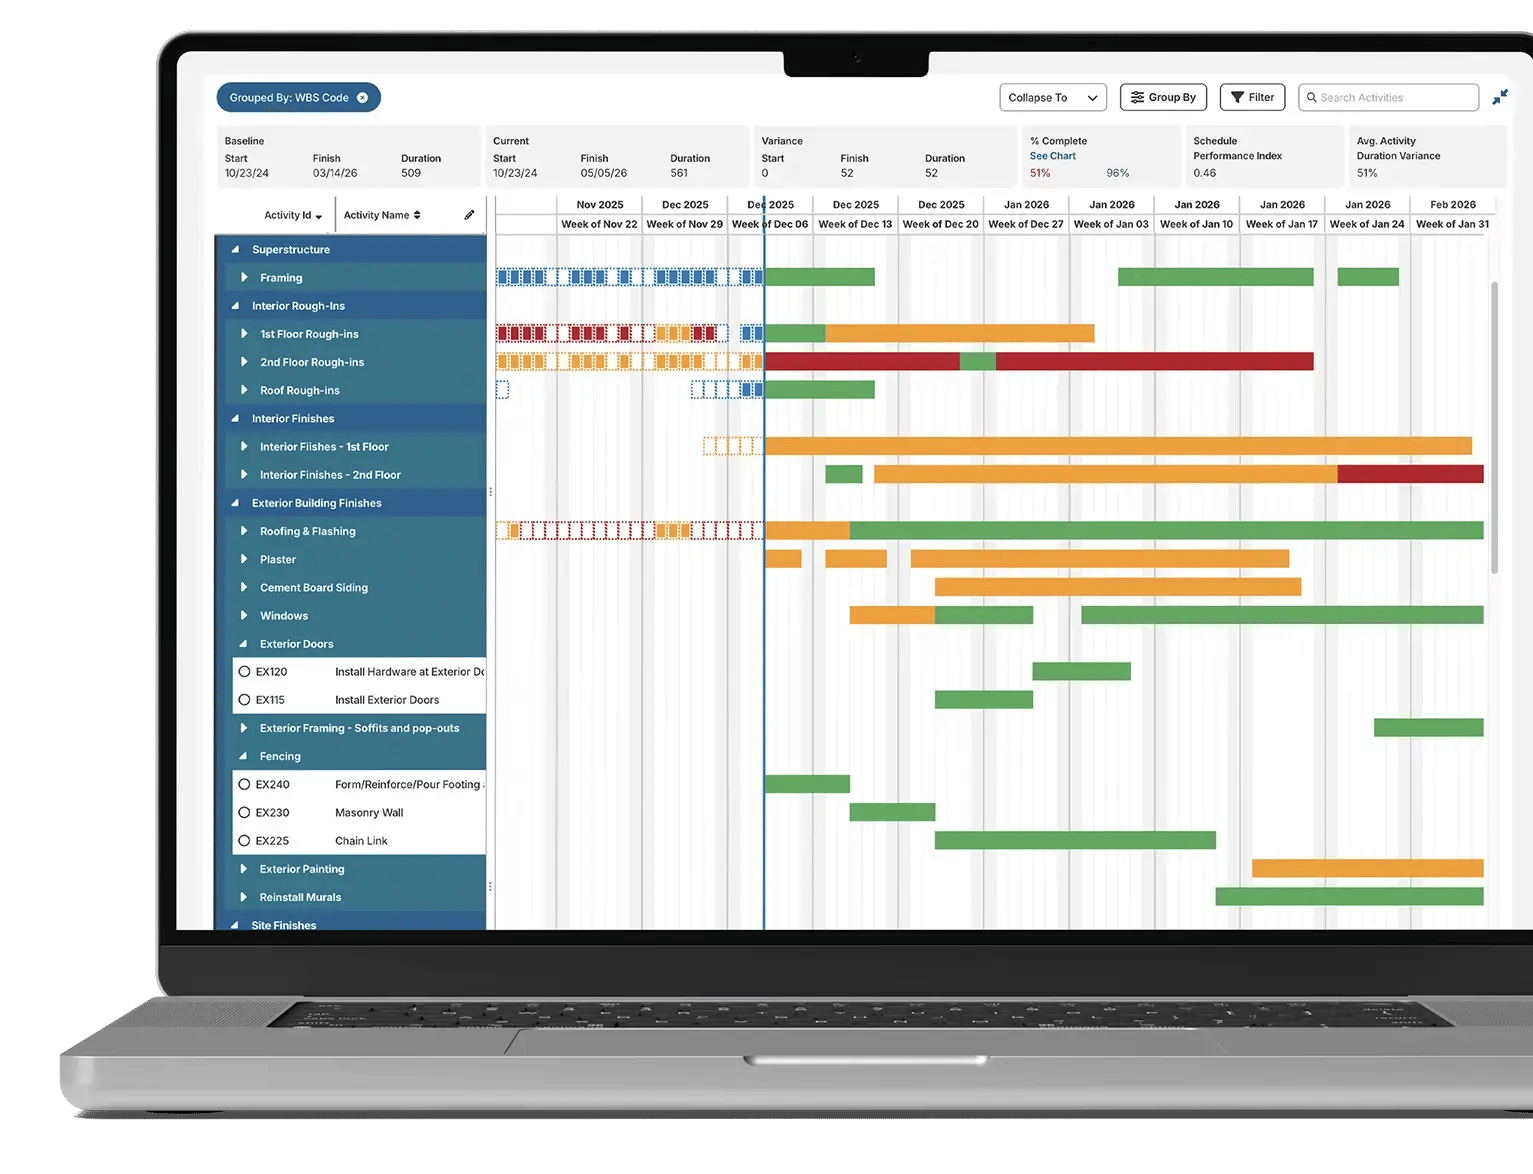
SmartPM’s Construction Gantt Chart gives you a clean view of your plan, progress, and logic in one interactive timeline. You can scan the entire job and open any activity for detail in seconds.
- See the schedule with clear drivers, paths, and real progress in one view
- Open any activity to understand its dates, logic, and production with full context
- Spot emerging risk early with accurate planned vs. actual performance
- Give every stakeholder a reliable, up-to-date schedule they can act on


True Progress
A Timeline Built for Transparency
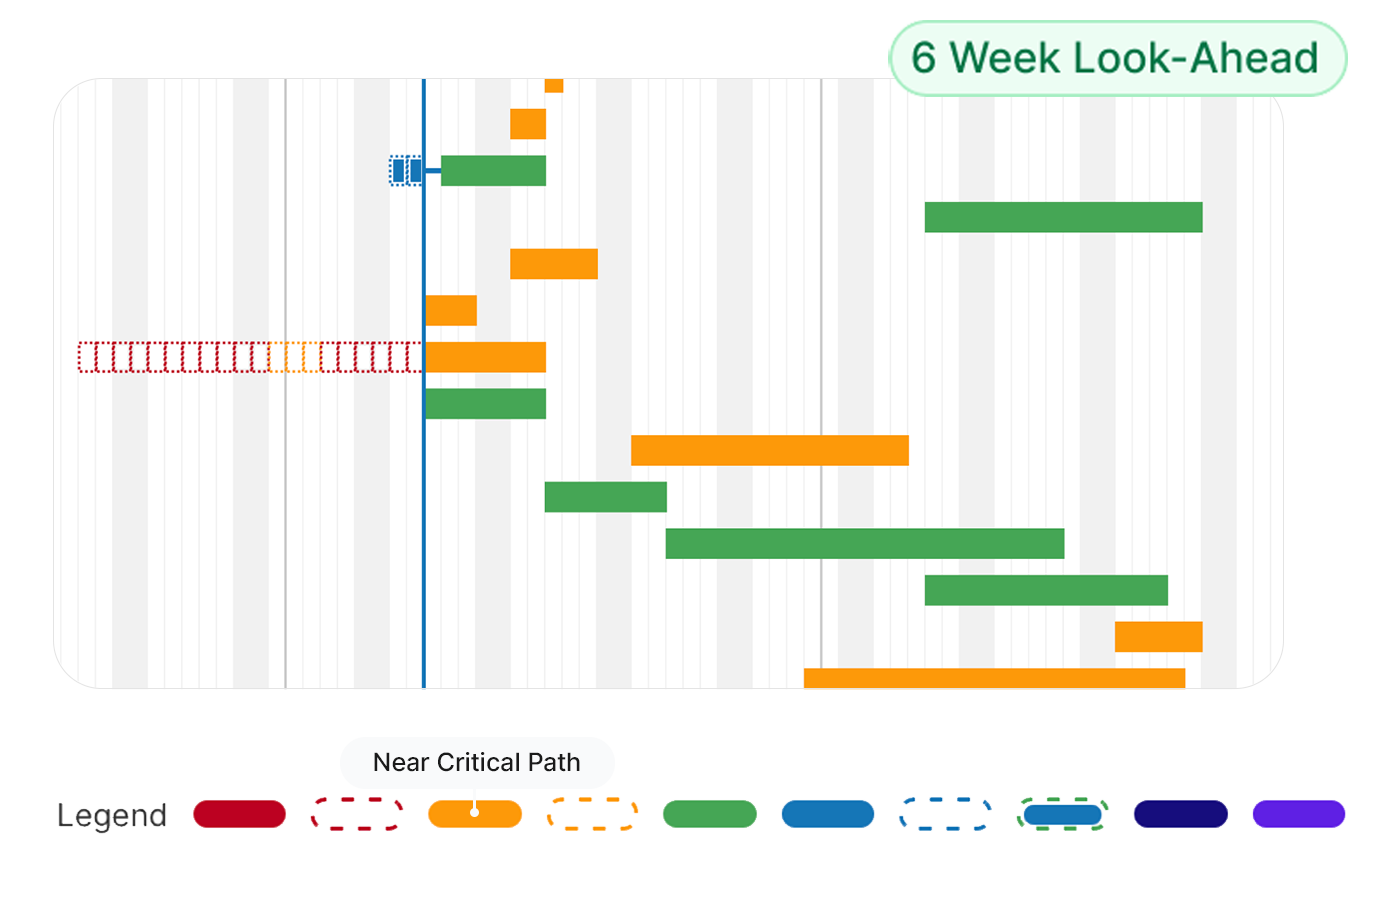
See real progress in context: critical and near-critical paths, historical shifts, no-progress periods, acceleration pushes, and planned vs. actual performance.

Full Context
Activity-Level Clarity When You Need Answers


Flexible Views
A View That Adapts to the Way Teams Work
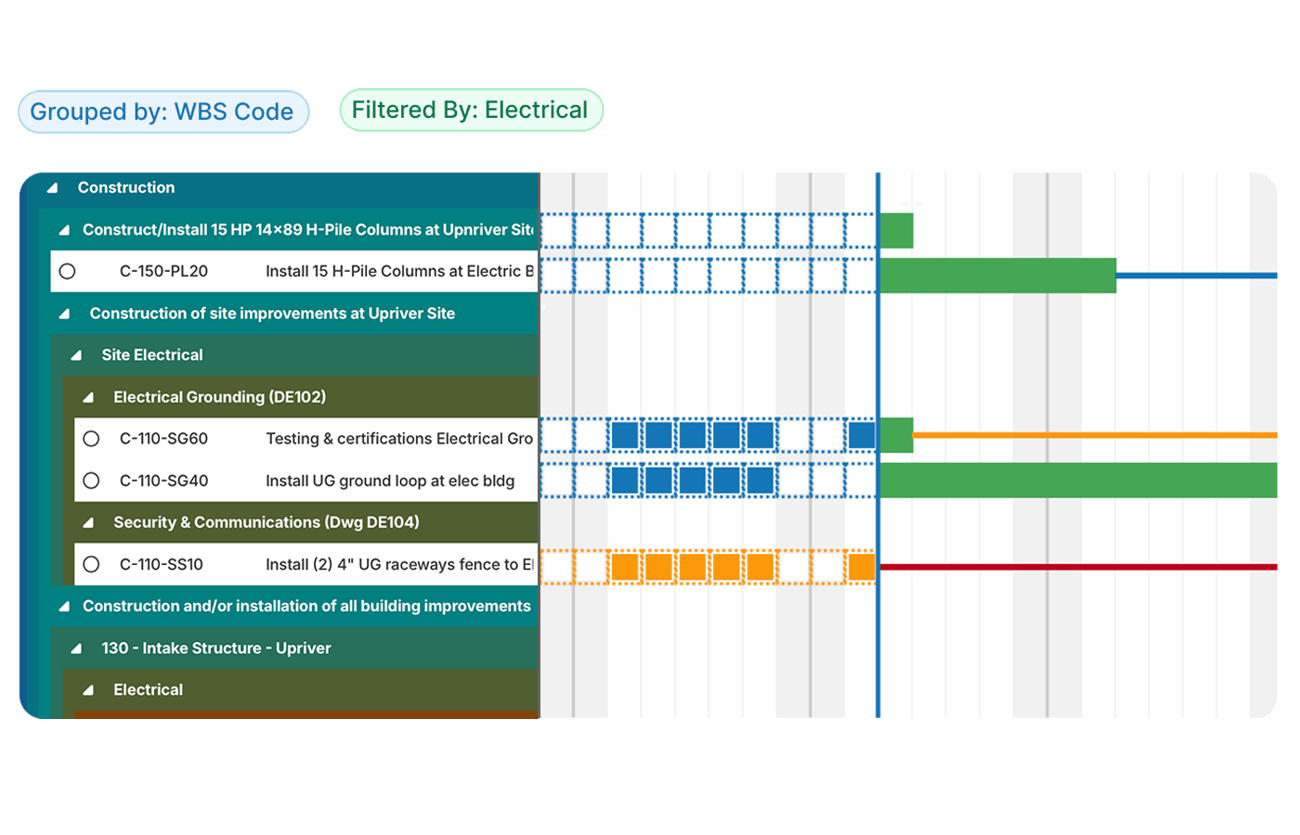
Group by trade or phase, collapse for an overview, expand for detail, filter for delays or lookaheads, search anything, and print accurate 3–6 week lookaheads.
Historical Insight
A Record You Can Rewind and Learn From
Feature's of SmartPM's Gantt Chart Software
Compare Baselines with Actuals
Track how your current project schedule aligns with the original plan. Use detailed visuals to identify gaps and keep stakeholders informed.
Safeguard Task Dependencies
Identify and resolve issues in scheduling logic to ensure all activities are properly connected, and workflows stay smooth.
Performance Management
Keep track of subcontractor progress with clear, real-time data. Ensure each task stays on schedule and within scope.
Track Milestones
Monitor key project milestones and deliverables with ease. SmartPM’s Gantt chart ensures all project phases are accounted for.
Change Logs
Access specific information about any activity, including start/finish dates, logic, performance metrics, and a change log for activity updates.
Field Logs
Access notes from the field, such as percent complete, cost loading, or resource tracking, to get a complete picture of progress straight from the job site.
-
SmartPM’s Web based Gantt Chart provides a dynamic view of your project’s timelines, allowing you to create a visual representation of historical and projected progress as well as detailed aspects such as delays, accelerations, and critical path activities. With its infinite scaling ability, you can drill down from day to quarterly views, examining the specifics of each activity, including their impact on project phases and the underlying logic of delays.
-
SmartPM’s filtering functions allow you to customize which project activities are displayed based on specific attributes on the Gantt. You can use built-in filters or create custom ones to focus on activities that have caused delays or acceleration, track progress made or missed, and even pinpoint activities on your actual historical-critical or near-critical paths.
-
Yes, SmartPM’s Gantt Chart allows you to directly track and analyze the critical path and any project accelerations. It provides visual indicators of the project’s progress, showing which activities are on the critical path, which are near-critical, and how changes in these paths impact the overall project schedule. This real-time insight is crucial for adjusting strategies and managing project timelines proactively.
-
We know across-the-board visibility is what truly drives success. That’s why every project benefits from unlimited users per project, so your team members can operate from a single source of truth.
“If your company wants to leverage data-driven, decision-making processes, and needs true insights into what’s really happening with the schedules on their projects, SmartPM is the product I would recommend.”
“Incredible Schedule Analytics Tool. SmartPM is super easy to learn and very effective when trying to communicate what is going on in the schedule. It is so quick and easy to upload your schedules into the software and within minutes have all of the metrics at your fingertips.”
“Some metrics we looked at in the past were lagging indicators. SmartPM provides leading indicators that give us time to adjust early and with more confidence.”
“SmartPM did everything we needed it to do and more. It allows us to identify potential roadblocks in our schedule – and do it early enough to remediate the issues.”
“Information to our owners is now 10X greater than before we had SmartPM. We uncovered a lot of risks that we did not know we had.
“The dashboard is easy at a glance. You can see health, compression, and the real end date in a single view.”
“The Windows Analysis is a game changer. What used to take me weeks or months on some projects now takes minutes or hours. I don't want to analyze any project without SmartPM anymore.”
“SmartPM’s interface was superior versus the competition, with essential metrics and reports clearly displayed and easy to find.”
“SmartPM is really helping us find and deal with the flaws in our baseline schedules and weekly updated schedules. It is saving us a lot of time by providing a cheat sheet on any issues with the schedule and points us right to the issue at hand instead of having to go dig for it.”
“The integration between SmartPM and Procore is huge for us because we don’t have to reinvent the wheel. We just add SmartPM into our current process to supplement it rather than change it.”