

Why Microsoft PowerBI Isn't Enough for Construction Schedule Analytics
PowerBI doesn’t know whether your schedule data is high quality, valid, or even trustworthy.

Blog
SmartPM’s schedule quality framework goes beyond the limitations of the DCMA 14-Point Check with 35+ customizable metrics.
In construction project management, schedule quality is not just a compliance checkbox, it’s a performance driver that directly impacts delivery, profitability, and risk. Construction project control tools must do more than track progress, they need to validate schedule integrity and forecast risk.
For decades, the industry has relied on the DCMA 14-Point Check, originally developed by the Defense Contract Management Agency (DCMA) for Department of Defense (DoD) projects, to assess baseline schedule quality. This checklist was a critical first step toward structured scheduling, but it wasn’t built for the complexity and variability of today’s construction projects.
In fact, according to SmartPM’s 2025 State of Construction Scheduling Report, only 12% of baseline schedules meet best-practice quality standards. Even more concerning: fewer than 5% of projects maintain that level of quality through closeout. That means most teams are building and managing schedules that do not meet the structural criteria needed to control a project effectively.
That’s why SmartPM’s 35+ metric framework focuses on what actually drives successful project delivery.
The DCMA 14-Point Check is a set of compliance-driven metrics used to evaluate Critical Path Method (CPM) schedules. It includes:
While useful for government compliance, the DCMA framework often fails in real-world construction because:
At SmartPM, we’ve spent the last several years speaking with hundreds of general contractors, project owners, schedulers, and consultants. Through these conversations, we learned what matters most to project teams and what actually drives real-world project outcomes.
We found that modern scheduling requires more than compliance checks; it needs tools that capture update accuracy, delay risk, field alignment, and real-time forecasting.
That’s why we developed a 35+ metric quality framework that addresses the realities of construction today.


SmartPM goes beyond the DCMA’s checks to cover the areas where most projects break down. Here are a few examples of additional metrics we include:
These metrics help project teams diagnose both structural and operational risks.

Customization That Reflects Real-World Complexity
Every project is different. That’s why SmartPM allows teams to customize their quality framework:
According to SmartPM’s industry data, 76% of projects finish later than their original baseline, often because the schedules were never set up for success.
Common pitfalls include poor baseline quality, inconsistent updates, logic breakdowns, and delayed risk recognition and response.
When these issues accumulate, teams are forced into last-minute schedule compression, a costly workaround that increases failure risk. SmartPM helps teams spot these issues early, before they escalate into disputes, delays, and lost profitability.
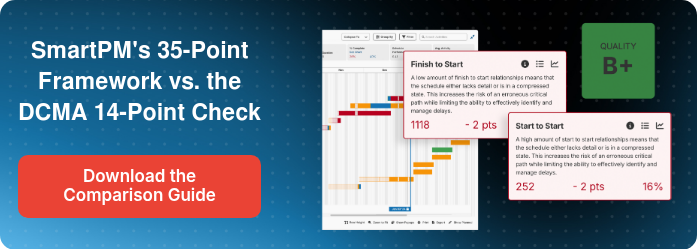
We’ve created a side-by-side comparison of SmartPM’s 35+ Quality Metrics vs. the DCMA 14-Point Check.
In today’s construction environment, managing schedule quality is about more than compliance, it’s about improving outcomes.
SmartPM’s schedule analysis platform helps project teams:
If you’re still relying solely on the DCMA 14-Point Check, it’s time to upgrade your approach.
Request a Demo to learn how SmartPM can help your team deliver projects on time, with fewer surprises.


