Visualize Project Status with Real-Time Construction Analytics
Gain a high-level understanding of all your individual projects with automated construction analytics distilled into clear, actionable insights.
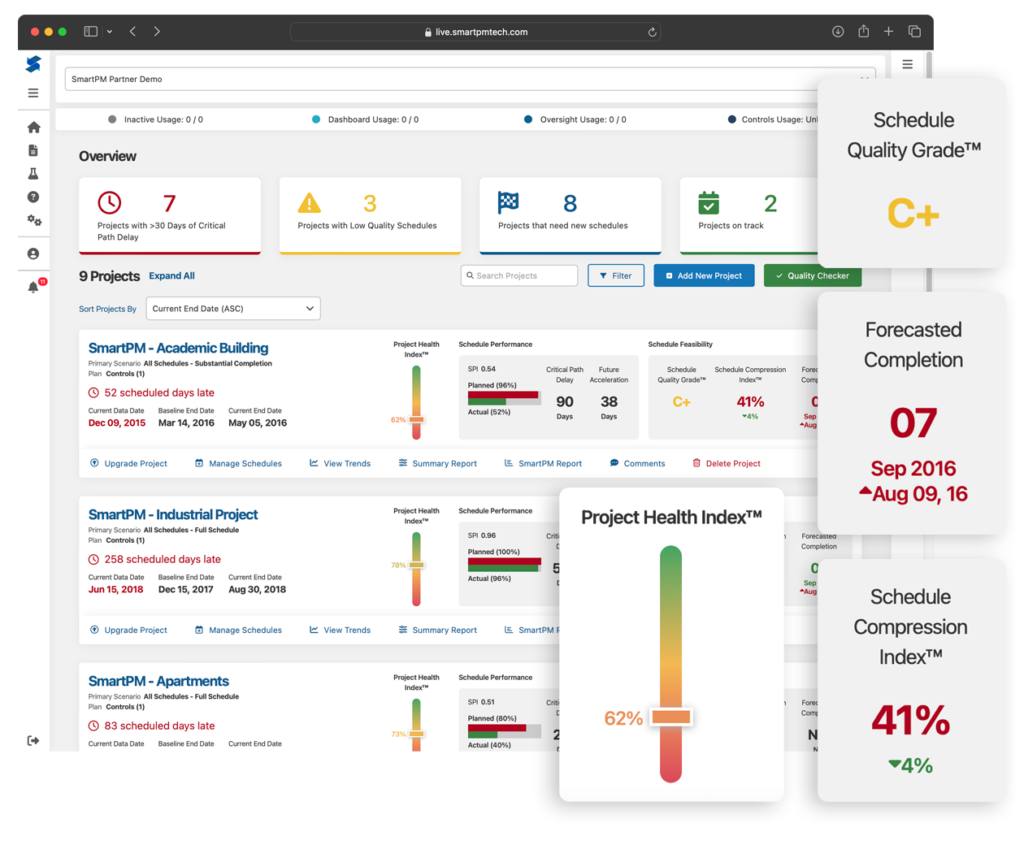
Get a holistic snapshot of all your projects in one place.
Get a clear view of your project’s KPIs with SmartPM’s project management dashboard, designed to quickly highlight progress, feasibility, and health for all of your projects.
Learn more about Executive Dashboard, Project Workspace and Web-Based Gantt
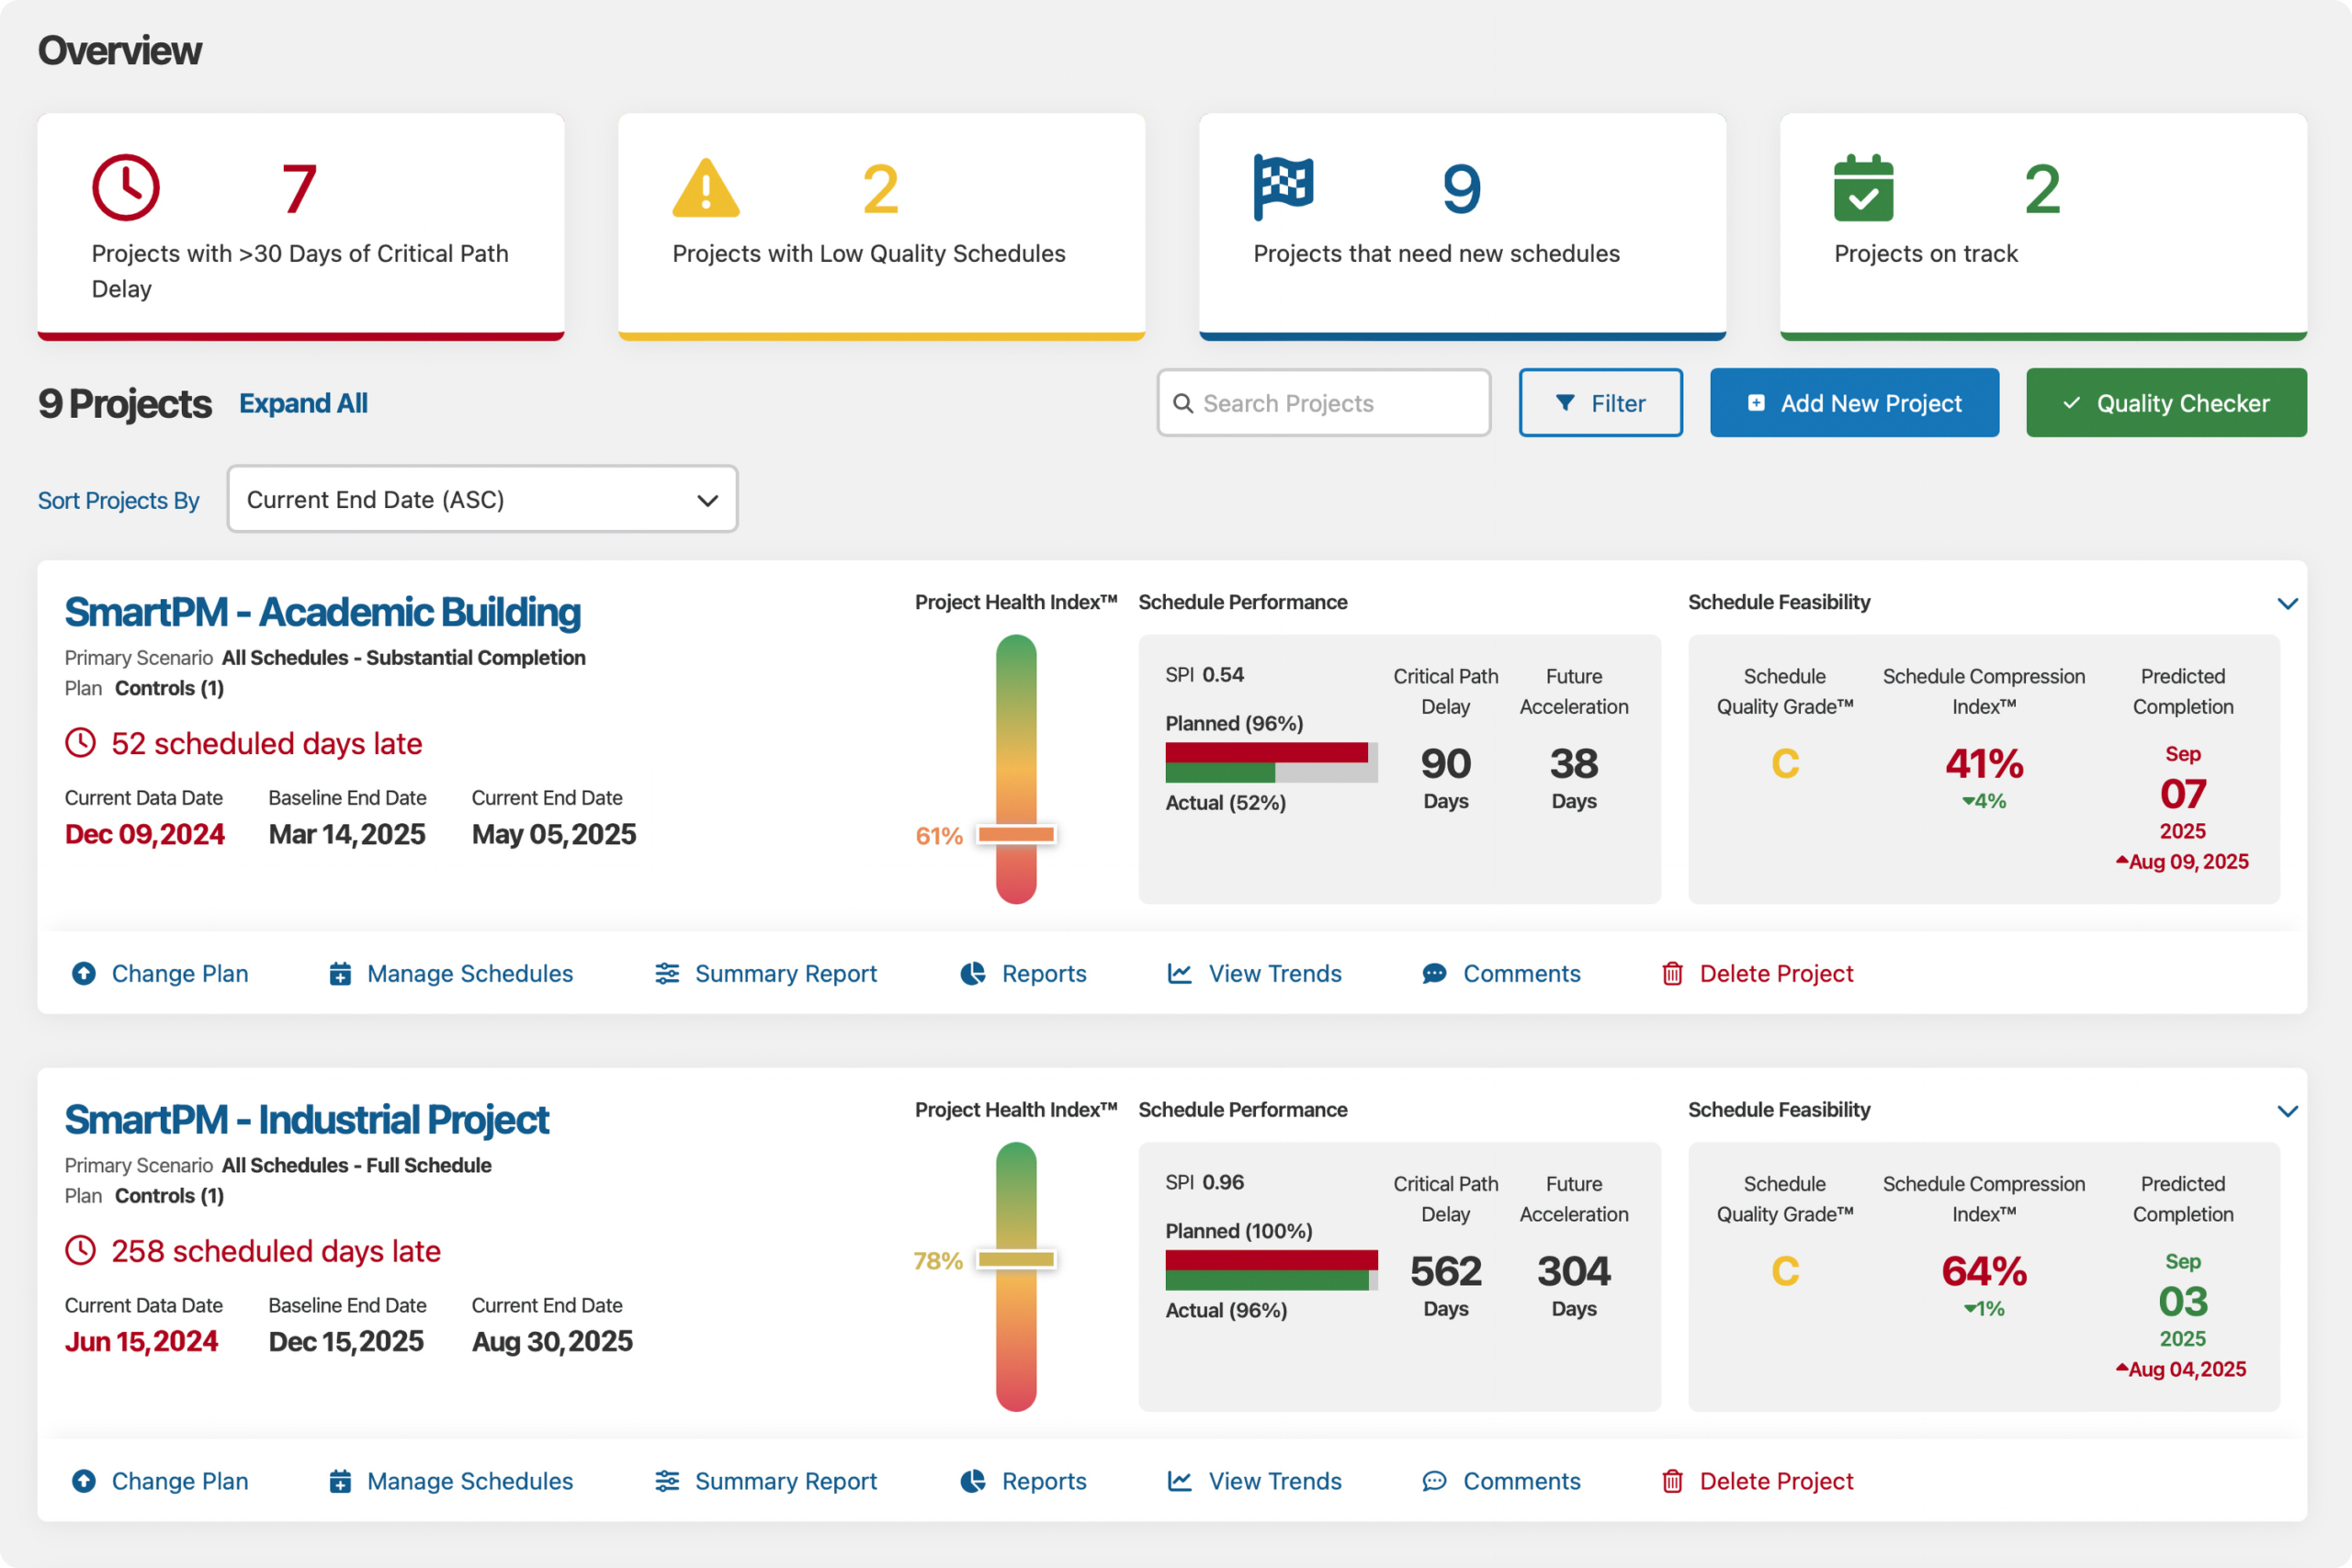
The number of projects that have a net critical path delay of more than 30 days.
The number of projects with a schedule quality grade of a C- or worse. This signals your schedule may contain some logical errors, heightening the risk of data inaccuracy and misleading critical paths.
The number of projects that have not received an update in over 30 days, signals potential issues with project tracking and the need for an update to ensure accurate and current project planning.
The number of projects with a net critical path delay of 30 days or less, provides a clear indication that the projects may not need as much attention as others in your portfolio.
The current number of calendar days that a project's end date is delayed as compared to the planned completion date of the project's assigned baseline schedule.
Data Date: The date on which data in the most recent schedule has been statused.
Baseline End Date: The end date of the earliest schedule in the Primary Scenario
Current End Date: The end date of the most recent schedule in the Primary Scenario
The Project Health Index™ is a gauge of overall project risk condition, based on a weighted calculation, taking into account Schedule Quality Grade™, SPI, and Schedule Compression Index.
The Schedule Performance Index displays the originally planned versus actual progress of the project compared to the baseline schedule.
The Critical Path Delay Metric is a calculation (days) of total cumulative critical path delay a project has suffered, as quantified in each update period and added together over time.
The Schedule Quality Grade™ is a gauge of the structural integrity of a project schedule, using a customized scoring model that is based on industry best practices.
Schedule Compression Index is the amount of effort remaining in the current schedule as compared to the baseline schedule.
This is an indicator of the effort required on an average day to meet the scheduled completion date as compared to the baseline schedule.
Schedule Compression Index will only calculate when you have multiple schedules loaded and your project is between 1% and 99.5% complete, as set by your company administrator.
The predicted completion date is SmartPM's estimated completion date if your performance continues as is. SmartPM looks at performance, compression, and delays, in order to determine how far off your current scheduled completion date.
This should be seen as a metric to help you determine if your schedule is overly aggressive or if you have feasible recovery (acceleration) plans in place to get your end date inline with your current scheduled end date.
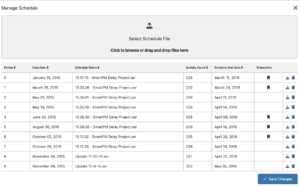
Add, Download, or View All project schedules.
Check the Quality of your schedule before loading it into your live project. Generate a quality report and export an excel file with all changes needed to increase schedule quality.
The filter toggle enables the user to set up filters on the dashboard to show a subset of projects based on the filters criteria.
Create a new project by importing your P6 or Microsoft Project files here
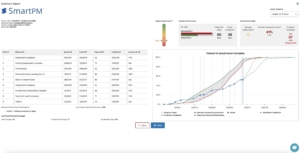
Within the Summary Report the planned vs. actual percent complete graphic is included, along with the dashboard metrics and table tracking baseline finish date, current schedule finish date, and variance for different milestones.
View and Select All Auto-Generated Reports
Charts, Info Cards, Performance Narratives, Detailed Tables
NEW FEATURE! Create Custom Reports and Automated Subscriptions
The title of the Projects Scenario "All Schedules - Substantial Completion" – is the name given to the scenario that the user has set to be represented on the dashboard.

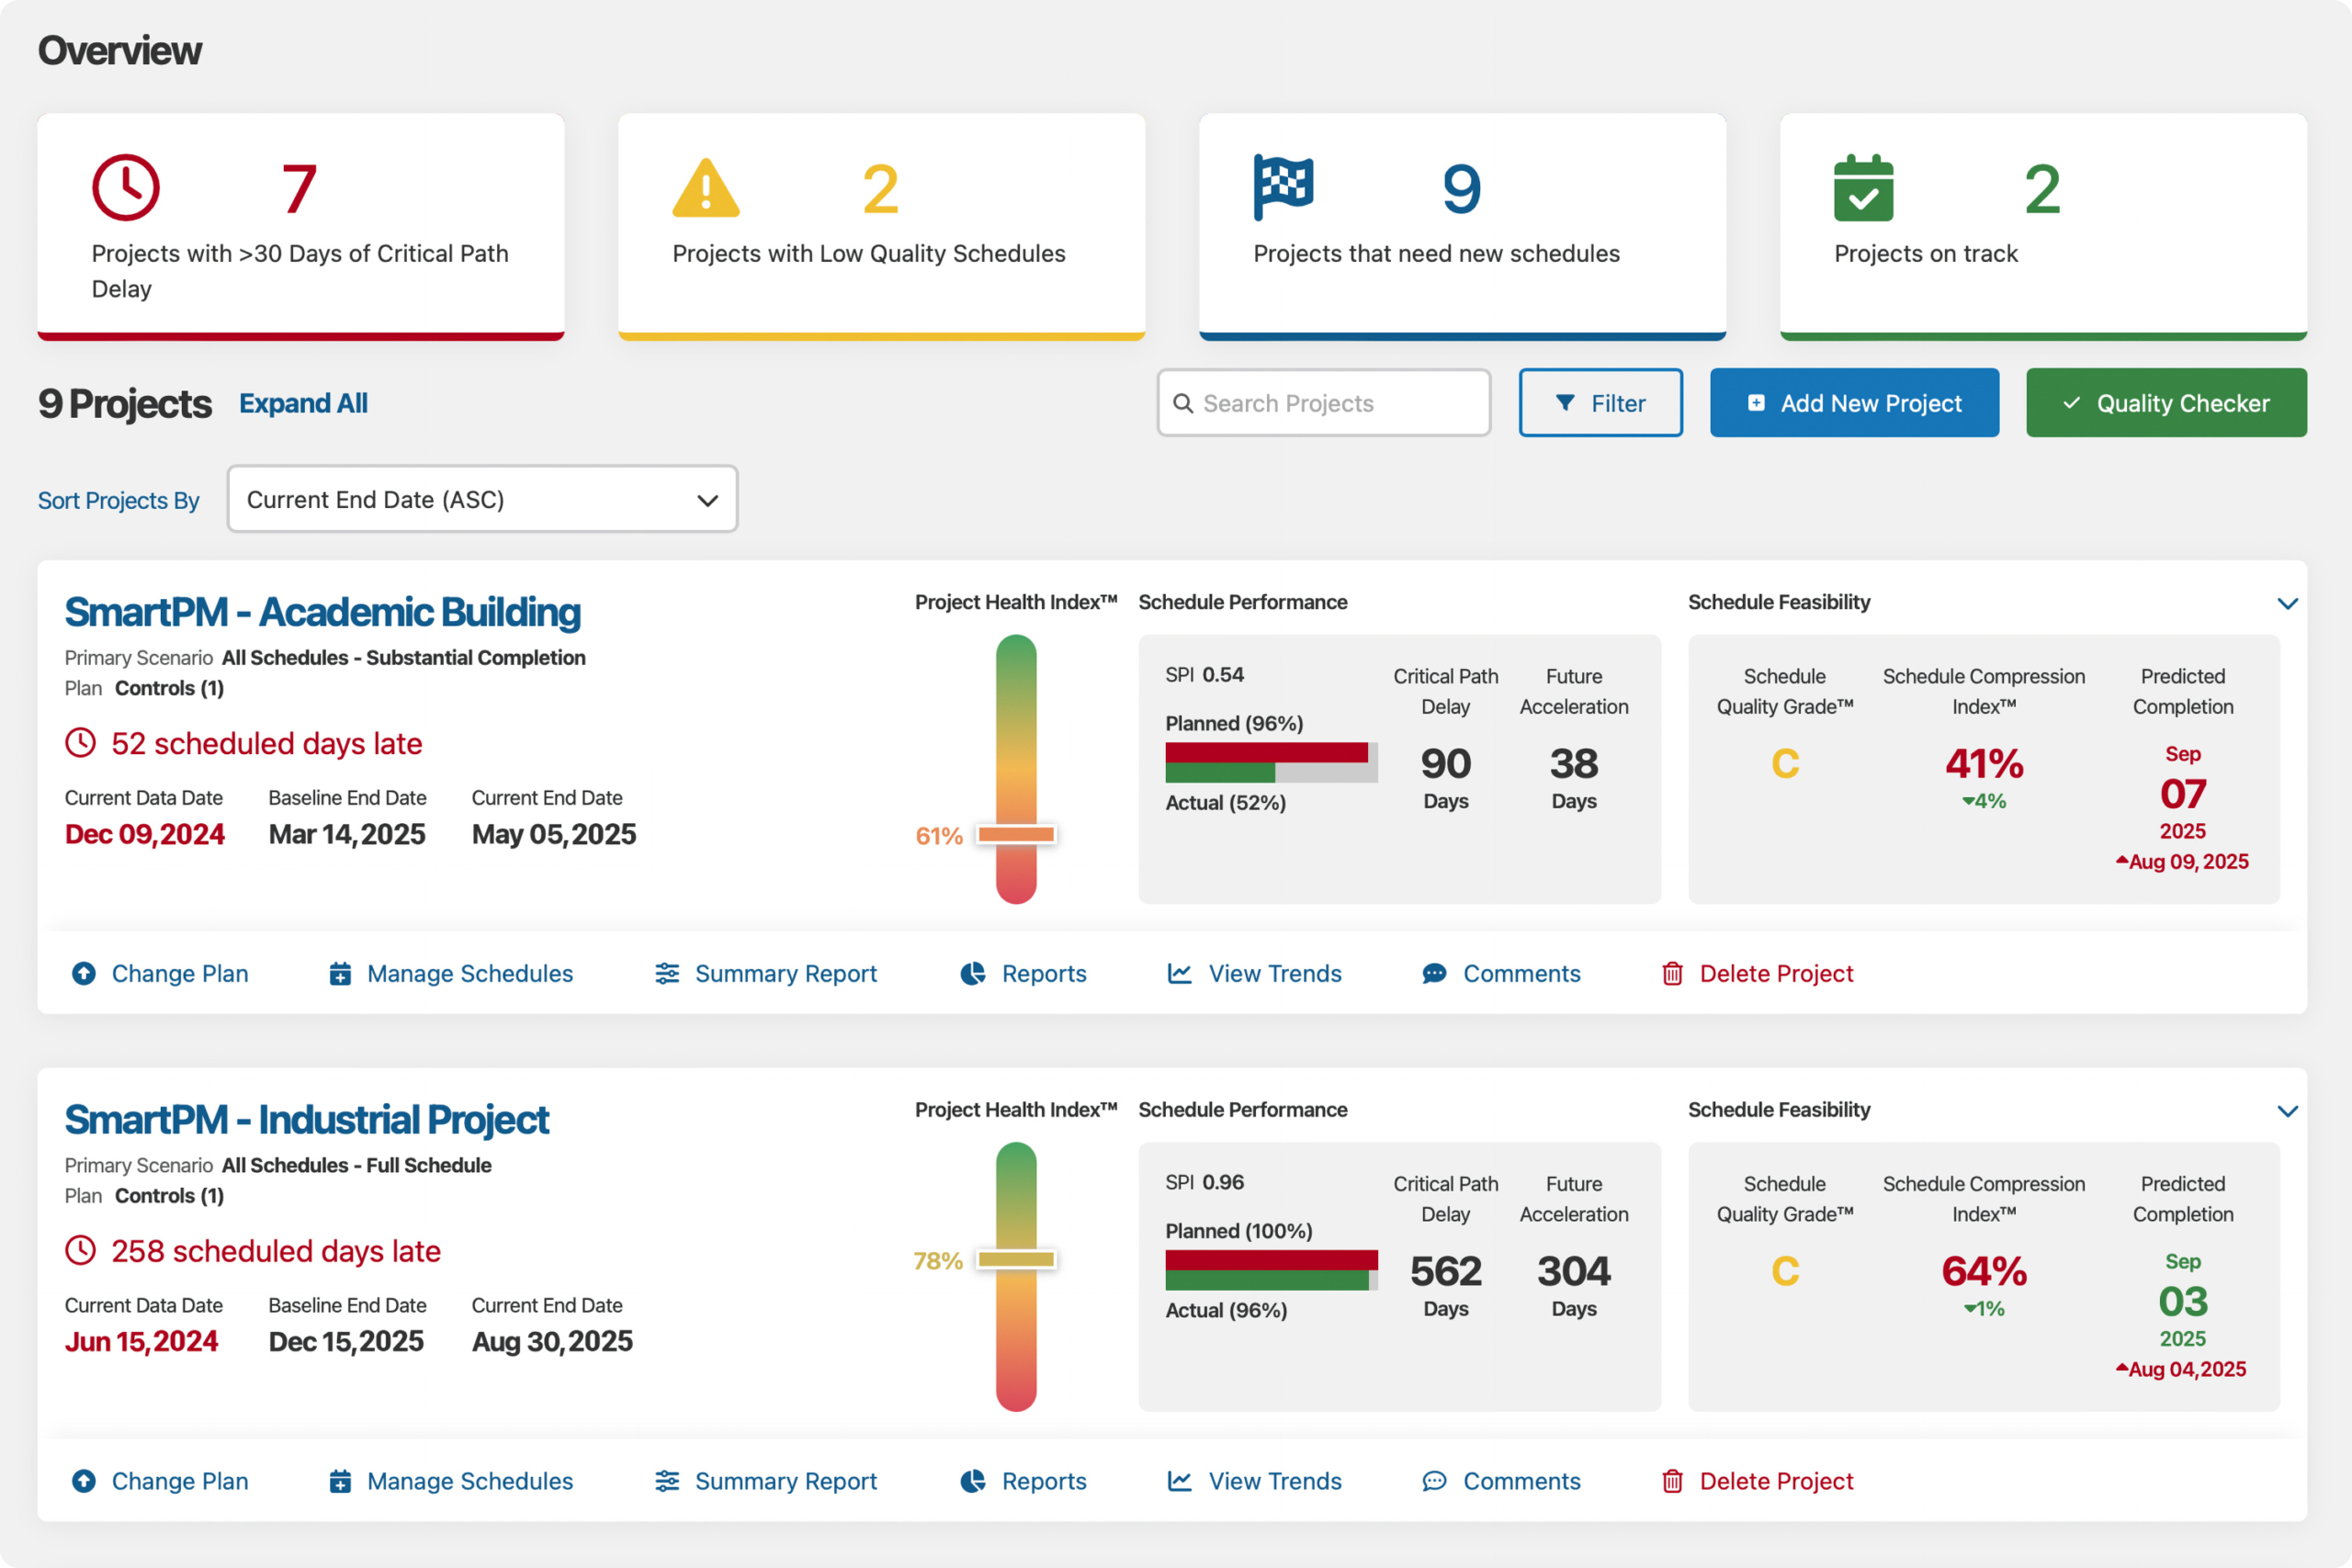
The number of projects that have a net critical path delay of more than 30 days.
The number of projects with a schedule quality grade of a C- or worse. This signals your schedule may contain some logical errors, heightening the risk of data inaccuracy and misleading critical paths.
The number of projects that have not received an update in over 30 days, signals potential issues with project tracking and the need for an update to ensure accurate and current project planning.
The number of projects with a net critical path delay of 30 days or less, provides a clear indication that the projects may not need as much attention as others in your portfolio.
The current number of calendar days that a project's end date is delayed as compared to the planned completion date of the project's assigned baseline schedule.
Data Date: The date for which data in the most recent schedule has been statused through.
Baseline End Date: The end date of the earliest schedule in the Primary Scenario
Current End Date: The end date of the most recent schedule in the Primary Scenario
The Project Health Index™ is a gauge of overall project risk condition, based on a weighted calculation, taking into account Schedule Quality Grade™, SPI, and Schedule Compression Index.
The Schedule Performance Index displays the originally planned versus actual progress of the project compared to the baseline schedule.
The Critical Path Delay Metric is a calculation (days) of total cumulative critical path delay a project has suffered, as quantified in each update period and added together over time.
The Schedule Quality Grade™ is a gauge of the structural integrity of a project schedule, using a customized scoring model that is based on industry best practices.
Schedule Compression Index is the amount of effort remaining in the current schedule as compared to the baseline schedule.
This is an indicator of the effort required on an average day to meet the scheduled completion date as compared to the baseline schedule.
Schedule Compression Index will only calculate when you have multiple schedules loaded and your project is between 1% and 99.5% complete, as set by your company administrator.
The predicted completion date is SmartPM's estimated completion date if your performance continues as is. SmartPM looks at performance, compression, and delays, in order to determine how far off your current scheduled completion date.
This should be seen as a metric to help you determine if your schedule is overly aggressive or if you have feasible recovery (acceleration) plans in place to get your end date inline with your current scheduled end date.
Check the Quality of your schedule before loading it into your live project. Generate a quality report and export an excel file with all changes needed to increase schedule quality.
The filter toggle enables the user to set up filters on the dashboard to show a subset of projects based on the filters criteria.
Create a new project by importing your P6 or Microsoft Project files here

Add, Download, or View All project schedules.

Within the Summary Report the planned vs. actual percent complete graphic is included, along with the dashboard metrics and table tracking baseline finish date, current schedule finish date, and variance for different milestones.

View and Select All Auto-Generated Reports
Charts, Info Cards, Performance Narratives, Detailed Tables
NEW FEATURE! Create Custom Reports and Automated Subscriptions
The title of the Projects Scenario "All Schedules - Substantial Completion" – is the name given to the scenario that the user has set to be represented on the dashboard.

Gain a high-level understanding of all your individual projects with automated construction analytics distilled into clear, actionable insights.

Monitor real-time developments in your projects, providing a clear picture of progress and health for strategic adjustments and proactive project management.
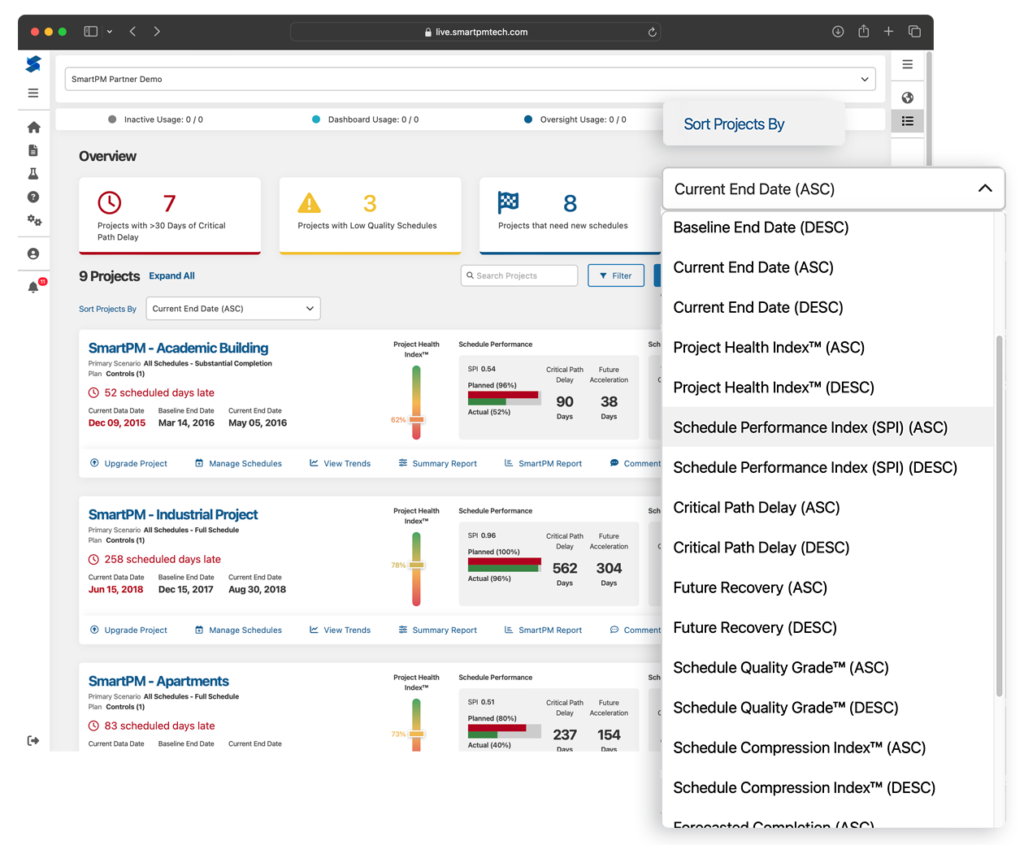
Focus your attention on where it matters most by using customized sorting options to drill down into the most critical aspects of your projects.
“The dashboard is easy at a glance. You can see health, compression, and the real end date in a single view.”
Pat Tolin - MCP Group
Give your entire team a clear line of sight into every project. SmartPM’s construction dashboards offer a clear view of project performance by turning complex data into actionable insights, helping teams spot risks early, track progress in real time, and streamline decision-making without unnecessary back-and-forth.
Still have a question? Contact us.
The Company Dashboard provides a centralized view of all your project schedules, offering a clear and comprehensive snapshot of your project KPIs (key performance indicators). It transforms intricate data into actionable insights, wrapped in a user-friendly interface that facilitates interactive engagement and a deeper understanding of project performance and health.
With the Company Dashboard, you can monitor real-time project developments. It provides a clear picture of each project’s status and health, allowing for strategic adjustments and proactive management to ensure projects stay on track and within scope.
The dashboard offers customized sorting options that enable you to focus on the most critical aspects of your projects. You can prioritize viewing data based on what matters most, such as project health, delays, or critical path issues, enhancing your ability to manage projects effectively.
The Schedule Performance features on the Company Dashboard include tracking actual vs. planned progress and the Schedule Performance Index (SPI). It also monitors critical path delays and predicts future accelerations, providing a dynamic tool for assessing your project’s adherence to the schedule and anticipating potential adjustments.
Schedule Feasibility offers insights into the quality and reliability of each project’s schedule. It displays schedule quality graded by custom criteria or color, and a compression index alongside predicted completion dates. These metrics help assess the feasibility of the schedules and identify potential issues that could impact project timelines.
Dashboards streamline how construction teams keep track of project performance by turning complex data points into clear visualizations. They make it easier to monitor progress, allocate resources, and identify potential issues before they escalate. With all key information in one place, teams can make informed decisions faster, ensuring milestones are met and projects stay on track.
SmartPM’s dashboards track critical KPIs that help teams make better decisions based on real-time project information. Common metrics include schedule quality, compression, SPI, critical path delay, and earned value. Tracking these KPIs ensures teams can monitor milestones, identify risks, and adjust plans to keep projects on schedule and within budget.
“SmartPM’s interface was superior versus the competition, with essential metrics and reports clearly displayed and easy to find.”
“Incredible Schedule Analytics Tool. SmartPM is super easy to learn and very effective when trying to communicate what is going on in the schedule. It is so quick and easy to upload your schedules into the software and within minutes have all of the metrics at your fingertips.”
“SmartPM is really helping us find and deal with the flaws in our baseline schedules and weekly updated schedules. It is saving us a lot of time by providing a cheat sheet on any issues with the schedule and points us right to the issue at hand instead of having to go dig for it.”
“SmartPM did everything we needed it to do and more. It allows us to identify potential roadblocks in our schedule – and do it early enough to remediate the issues.”
“Information to our owners is now 10X greater than before we had SmartPM. We uncovered a lot of risks that we did not know we had.”
Schedule a personalized product walkthrough with a product expert
Learn how SmartPM can help: Book a Demo or call 404.329.3000
53 Perimeter Center East, Suite 450 Atlanta, GA 30346
Copyright 2024 SmartPM Technologies, Inc. All rights reserved.