


Take their word for it
“If your company wants to leverage data-driven, decision-making processes, and needs true insights into what’s really happening with the schedules on their projects, SmartPM is the product I would recommend.”
Take their word for it
“Incredible Schedule Analytics Tool. SmartPM is super easy to learn and very effective when trying to communicate what is going on in the schedule. It is so quick and easy to upload your schedules into the software and within minutes have all of the metrics at your fingertips.”

Take their word for it
“Some metrics we looked at in the past were lagging indicators. SmartPM provides leading indicators that give us time to adjust early and with more confidence.”
Take their word for it
“SmartPM did everything we needed it to do and more. It allows us to identify potential roadblocks in our schedule – and do it early enough to remediate the issues.”
Take their word for it
“Information to our owners is now 10X greater than before we had SmartPM. We uncovered a lot of risks that we did not know we had.

Take their word for it
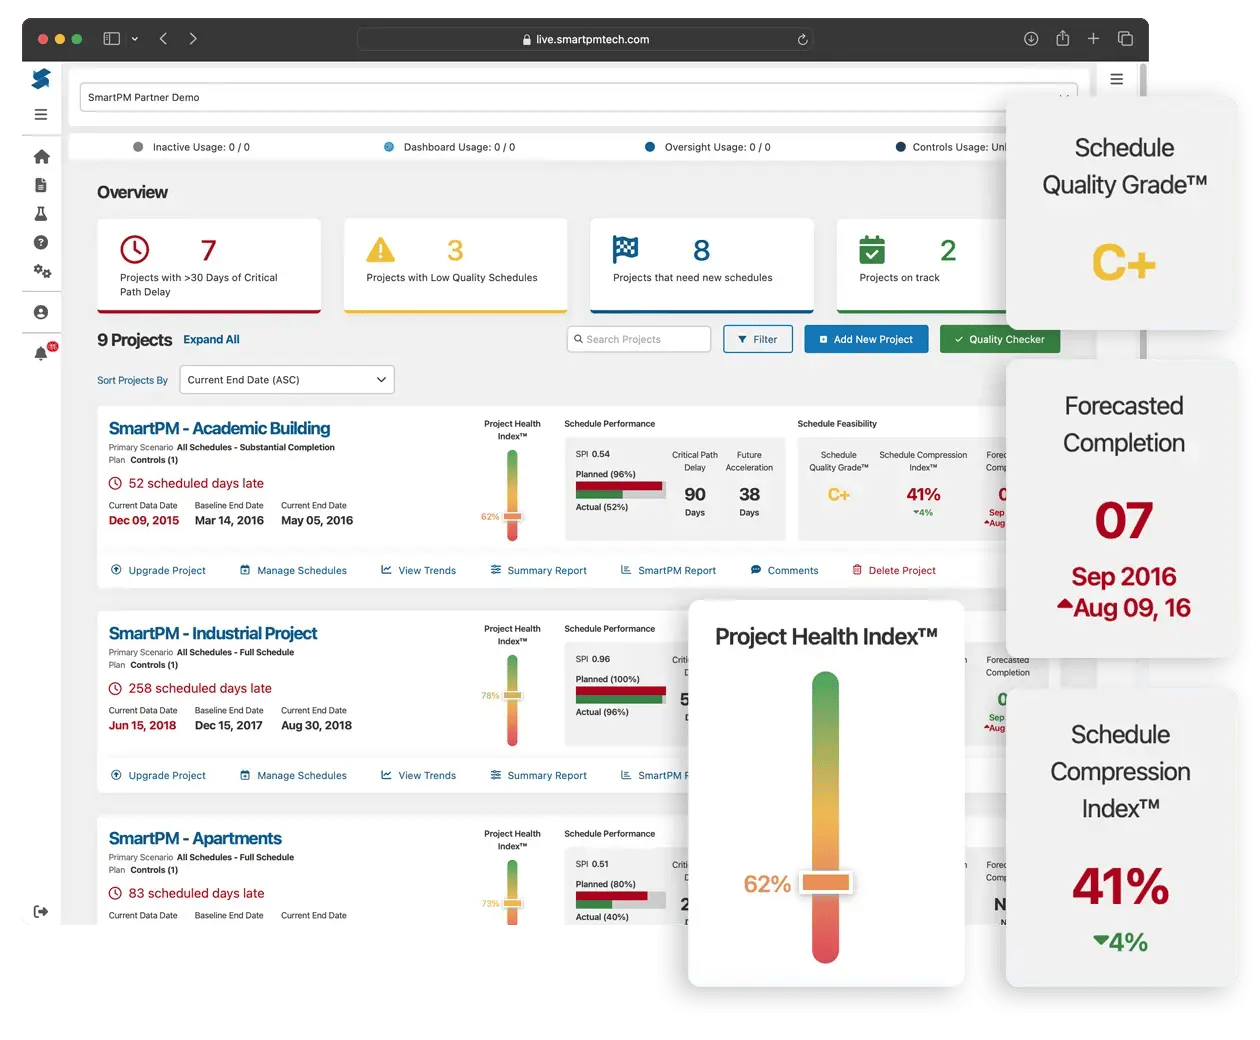
“The dashboard is easy at a glance. You can see health, compression, and the real end date in a single view.”
Take their word for it
“The Windows Analysis is a game changer. What used to take me weeks or months on some projects now takes minutes or hours. I don't want to analyze any project without SmartPM anymore.”
Take their word for it
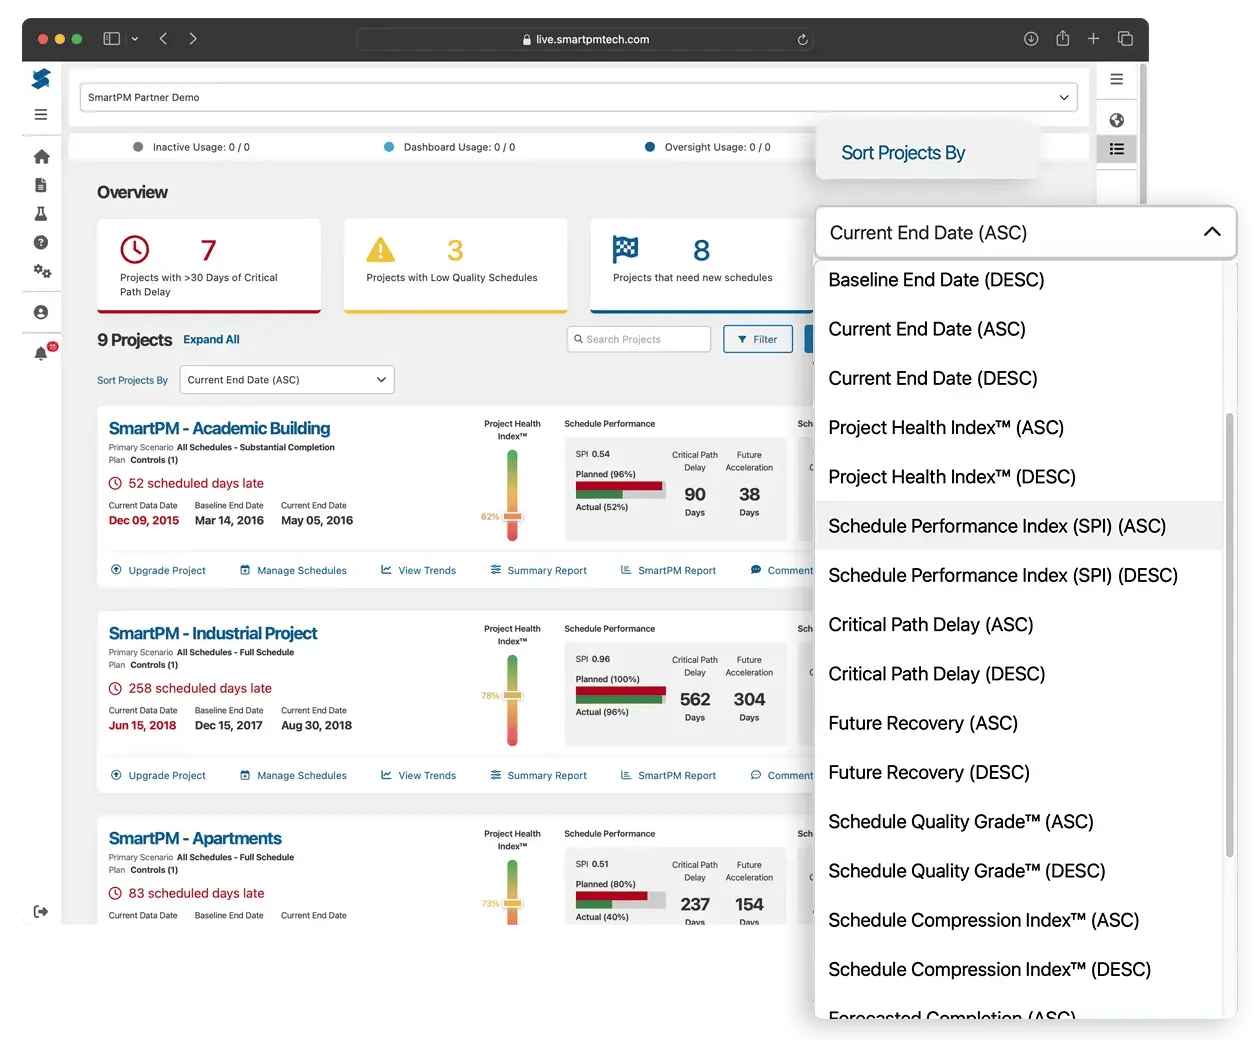
“SmartPM’s interface was superior versus the competition, with essential metrics and reports clearly displayed and easy to find.”
Take their word for it
“SmartPM is really helping us find and deal with the flaws in our baseline schedules and weekly updated schedules. It is saving us a lot of time by providing a cheat sheet on any issues with the schedule and points us right to the issue at hand instead of having to go dig for it.”
Take their word for it
“The integration between SmartPM and Procore is huge for us because we don’t have to reinvent the wheel. We just add SmartPM into our current process to supplement it rather than change it.”