Zachry Construction Corporation
Zachry Construction Corporation Adds SmartPM to Its Scheduling Toolbox–and Its Investment Portfolio

Zachry Construction Corporation

When Ranjeet Gadhoke, Vice President of Project Controls at Zachry Construction Corporation, went looking for a schedule-data analytics tool, he experimented with numerous options, each with one or more shortcomings.
Some of the programs, recalled by Gadhoke, were too laser-focused, with a “micro view,” lacking the big-picture perspective. Others were not “graphical” enough, generating pages of data while lacking the comprehensive insights his team demanded. He described one of the programs with the colloquialism: “It was like putting lipstick on a pig.”
But that was just the tip of the iceberg.
“To make matters worse, we would have to export information from our scheduling program and build our own S-curves, calculate schedule compression, and compute float consumption. When the KPIs were finally calculated, it was time to do another monthly update. It was so difficult to get information that it was almost irrelevant by the time we got it.”
And, of course, there was the schedule itself.
“I needed a tool that could analyze the schedule for delays, overruns, and other potential obstacles,” Gadhoke said. “All of the other capabilities we were looking for were certainly critical, but if we could get a platform that could also help us better manage the entire schedule on a project, we would not hesitate to pull out our checkbook.”
Gadhoke’s exhaustive search led him to SmartPM, the premier schedule-data analysis tool. SmartPM checked all of the relevant boxes for Zachry Construction Corporation, and the checkbook appeared. Suffice it to say–with the automation of SmartPM–there would no longer be a need to manually calculate schedule compression or other KPIs.
“SmartPM does everything we needed it to do and more,” said Gadhoke. “It allows us to identify potential roadblocks in our schedule and does it early enough to remediate the issues. It presents information in a graphical format, allowing us to communicate a project’s status quickly and easily. And it can be used to create a high-level overview for the C-Suite executives or a deep dive for the site team.
“It all goes back to how the product analyzes data. No one else examines the data the way SmartPM does.”
SmartPM starts with the assigned “data creators”: the area schedulers and area-control personnel. They produce their monthly update and load it into SmartPM. Once populated, they review the data. If anything raises a red flag, they communicate with the project managers.
“We have a monthly meeting with 70-80 people, reviewing one region at a time,” Gadhoke explained.” “Before we start the meeting, I show the information generated by SmartPM. This means everybody sees it at one time. We’ve got all kinds of dashboards that present the information in a graphical, easy-to-comprehend format. When the meetings are adjourned, there is a crystal-clear understanding of all the regional projects.”
Gadhoke also noted that SmartPM provides top-level executives at involved in a project with one of the most valuable assets: predictability.
“By and large, CEOs are good at managing risk. But if they’re using garbage data, it’s hard for them to forecast where they’re going. And, when the predictability disappears, CEOs lose interest in whatever we’re telling them. SmartPM helps us provide CEOs with the data they require to determine where the job is going from both a time and cost perspective, making risk management much easier.”
Gadhoke also gains visibility of Zachry Construction’s entire construction portfolio, which is handy given that he manages multiple projects.
“You see something that’s falling behind, or you notice a project was compressed 10% one month, then 25% the next month, but the end date hasn’t moved. You can begin to ask questions about whether there are other areas where people could be performing parallel work.
“You get to see a simple dashboard; as you study it over time, you can train your mind to see the difference in the deltas. Because of this visibility, communication with management is greatly facilitated.”
Because of the visibility and predictability SmartPM provides Zachry Construction, performing a delay analysis takes minutes and is fully automated. Gadhoke offered an example to illustrate this point.
“One of the projects we worked on experienced delays. Previously, it was hard to pinpoint where they happened. Once I brought in SmartPM, I could show exactly how the delay occurred, and the owner had no trouble following the data. Ultimately, this helped us negotiate the claim much more in our favor. The owner told us that contractors usually come in and place blame. SmartPM analyzed exactly what fell on him and what was on us.”
Aside from all of the aforementioned benefits Gadhoke and Zachry Construction have experienced with SmartPM, Gadhoke plans to expand the use of SmartPM to leverage more of the program’s capabilities and apply it to the bidding process.
“It all goes back to how the product analyzes data. No one else examines the data the way SmartPM does.”

Founded in 1924, Zachry Construction Corporation is a privately owned heavy and civil construction company with headquarters in San Antonio, TX, and regional offices throughout the United States. Zachry’s body of work started with a single bridge project in Laredo, Texas. Today, Zachry’s portfolio spans more than 5,500 diverse construction projects for clients all over the world. Driven by its extraordinary and innovative team, and their unwavering commitment to its Core Values, Zachry has pioneered techniques that have become the basis of modern heavy construction.

Get to know five key metrics that can help you start creating controls in construction with your project schedule data.

Learn how to create a baseline schedule with conventional CPM Scheduling tools in 7 steps.

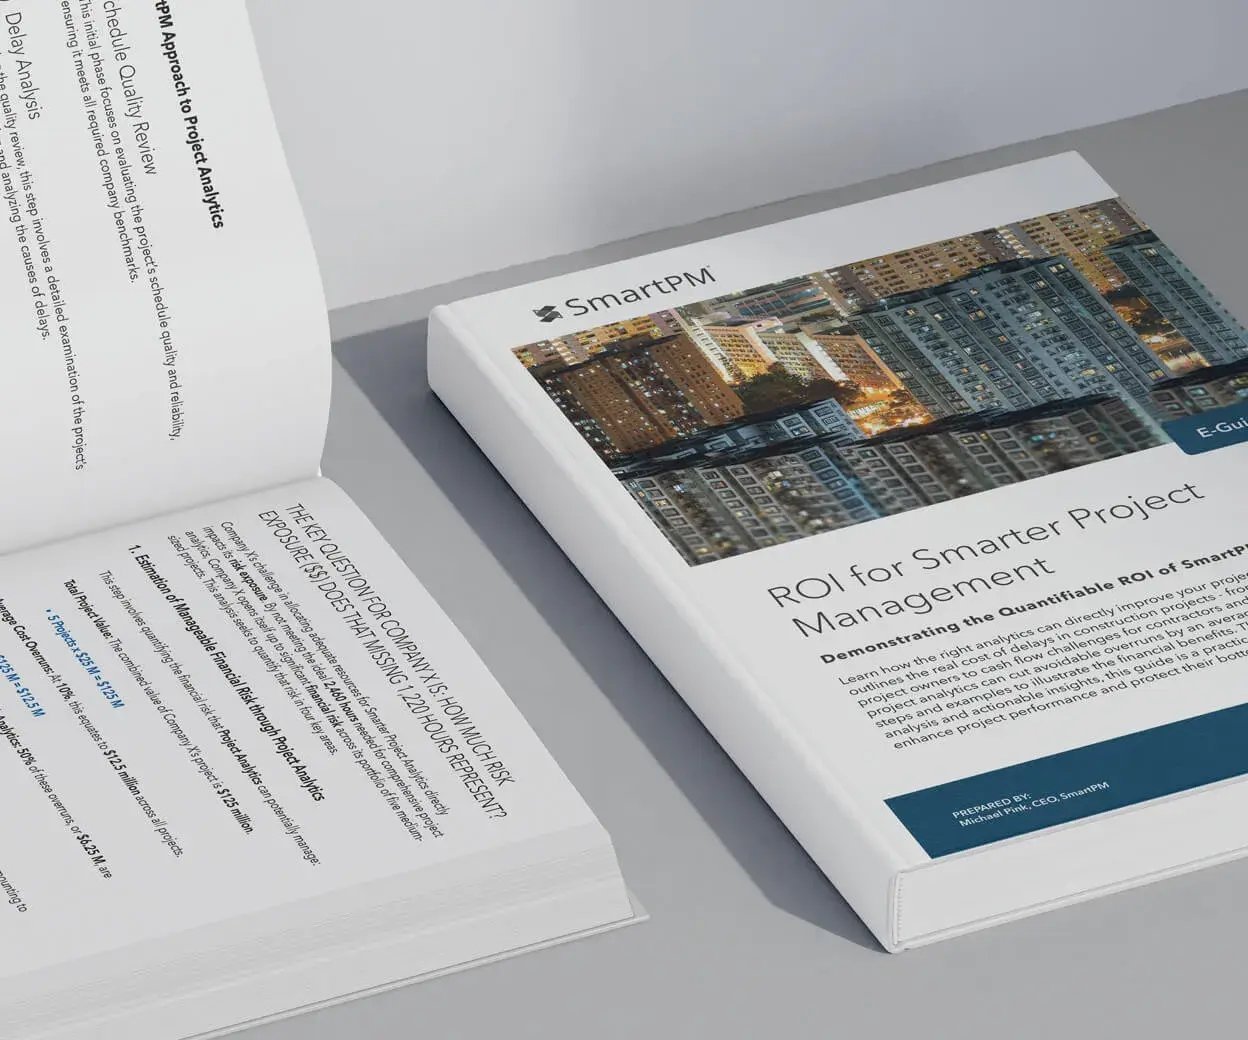
Find out how the right analytics have led countless organizations to recognize the positive ROI for Smarter Project Management.

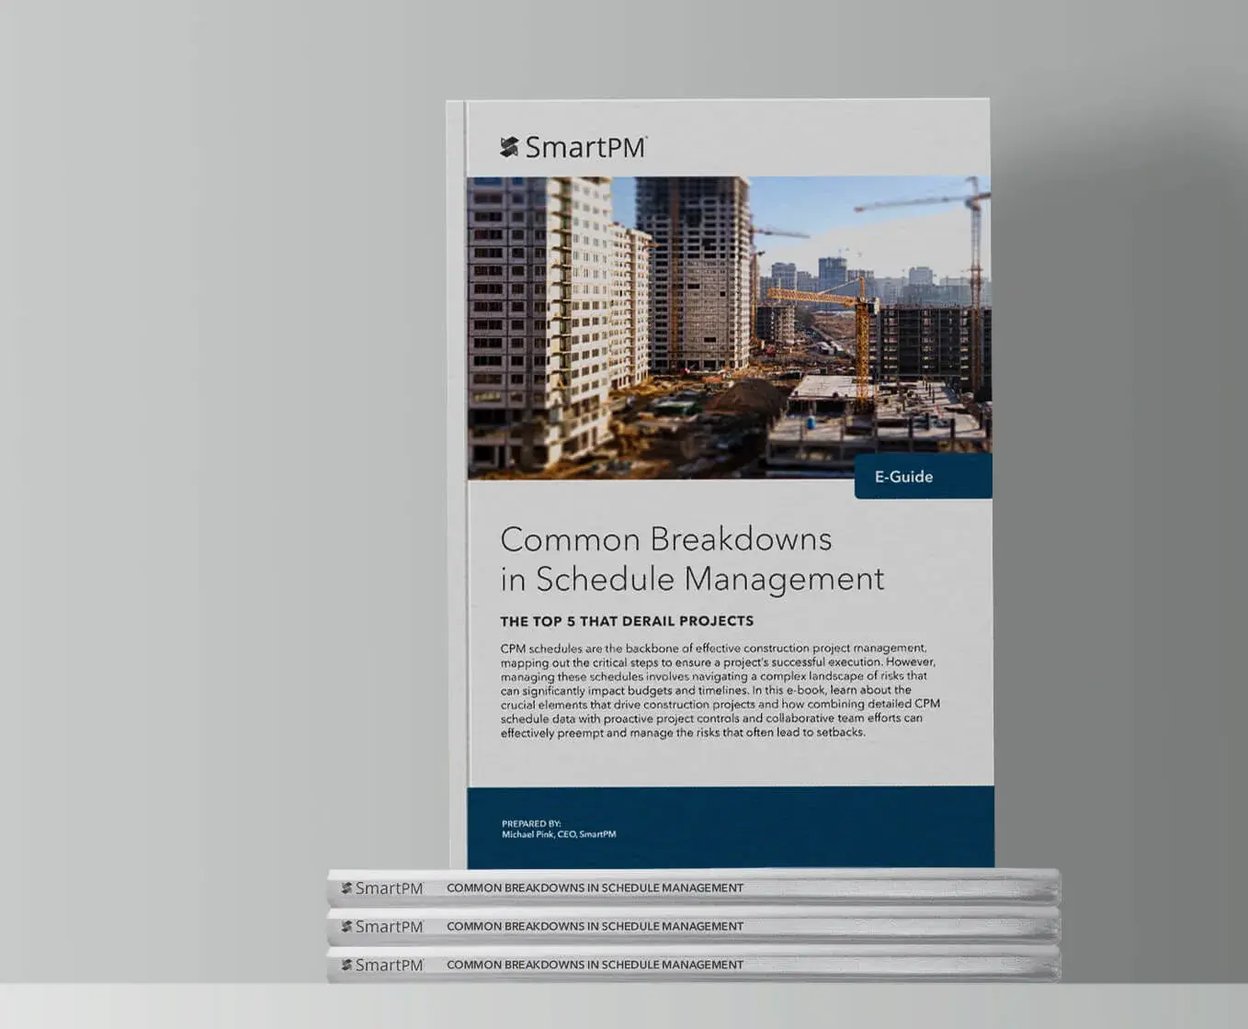
Understand five common pitfalls in construction scheduling that consistently derail projects and how to overcome them in our eGuide.
