Automated Project Controls Technology
Project Controls Software Built for Construction
Ensure your schedule is a reliable tool for smart project management.
Better Controls, Better Data, and Better Outcomes for Construction Projects

Leverage the Data You Have
Manage Risk
Protect your business against the potential risks inherent to the construction industry.

Improve Project Performance
Continuous oversight of project planning and management against established benchmarks.

Control Outcomes
Capture and understand data to constructively influence project outcomes.


Built for General Contractors, Owners and Developers in Commercial Construction
Executive Dashboard
Make informed decisions faster with business intelligence, aggregated data, and interactive trends across your entire project portfolio.
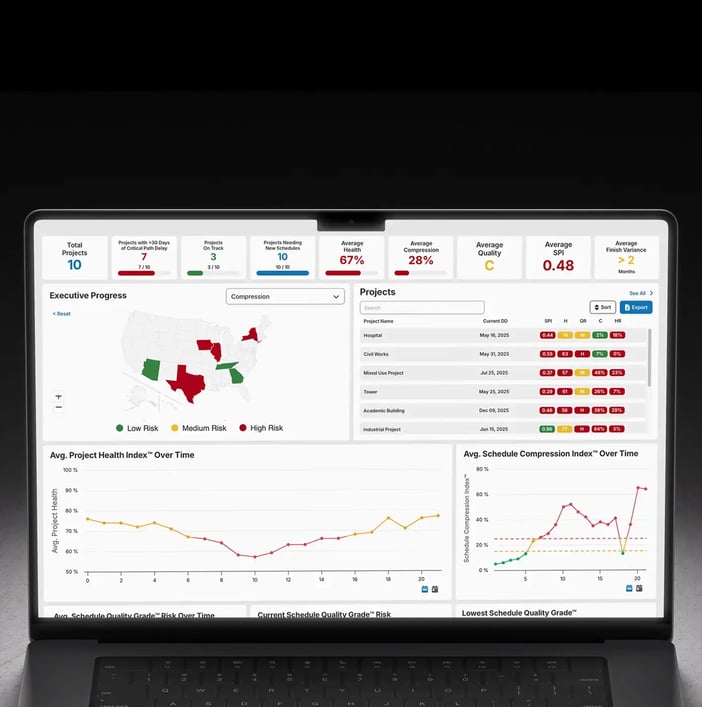 Read more about Executive Dashboard
Company Dashboard
A centralized view of all your project KPIs, transforming intricate data into quick and actionable information.
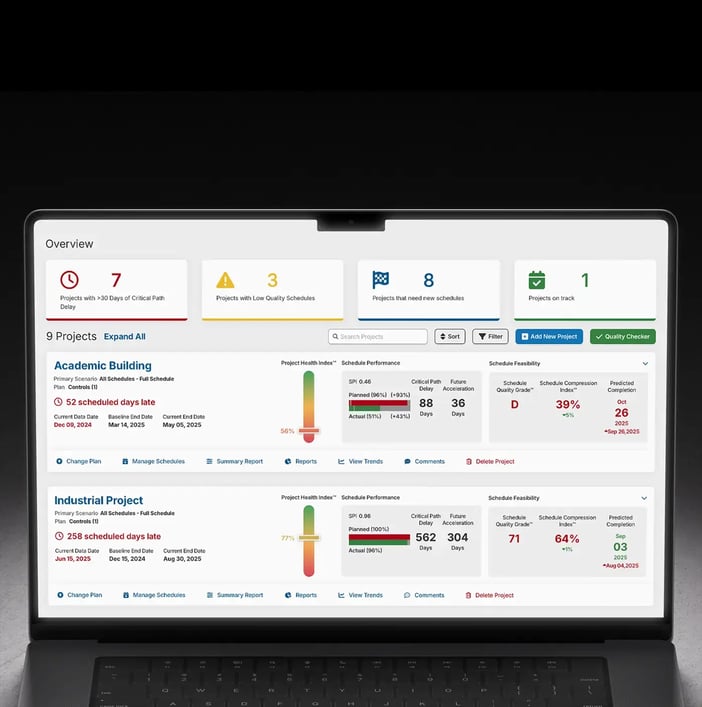 Read more about Company Dashboard
Project Workspace
Complex analytics simplified in a customized layout, designed for intuitive understanding and proactive management.
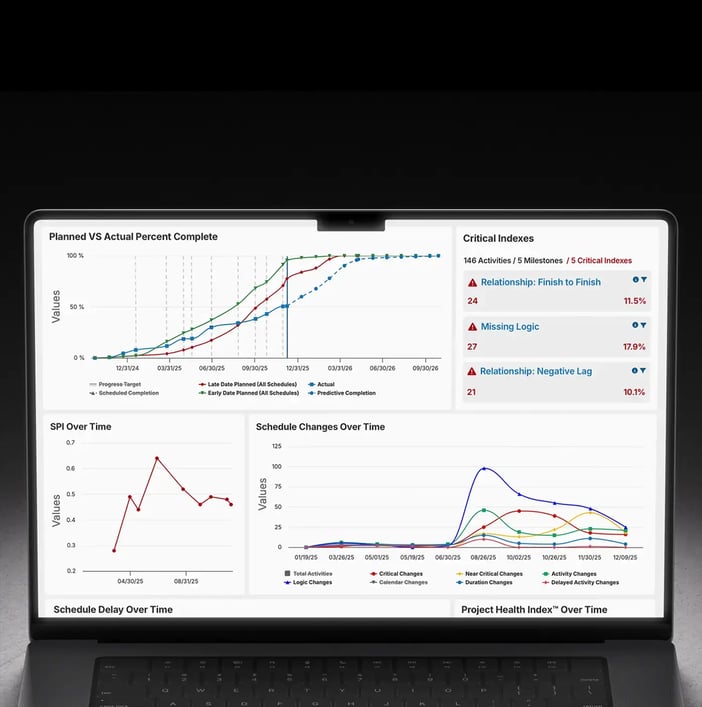 Read more about Project Workspace
Fully Web-Based Gantt
See a dynamic view of your project’s timelines, showing historical and projected progress, delays, accelerations, and critical path activities.
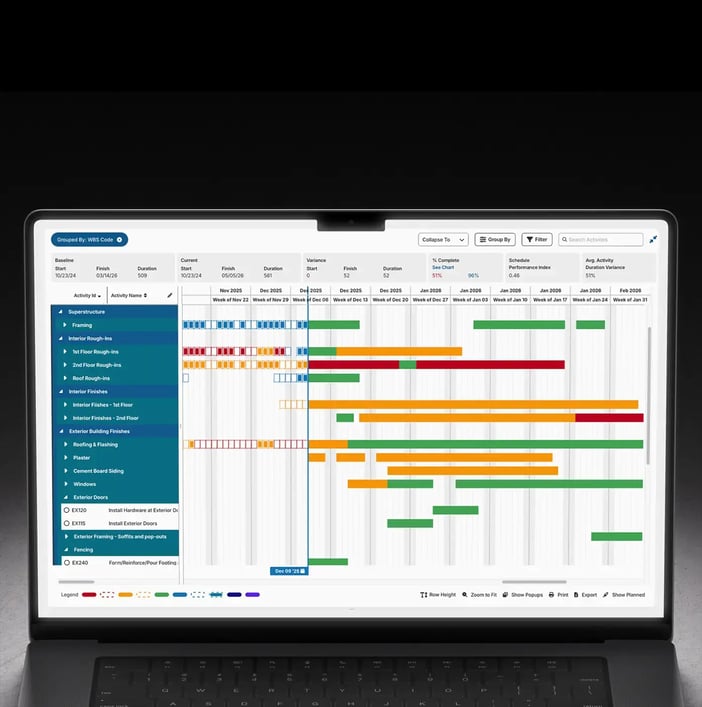 Read more about Fully Web-Based Gantt
“If your company wants to leverage data-driven, decision-making processes, and needs true insights into what’s really happening with the schedules on their projects, SmartPM is the product I would recommend.”
“Incredible Schedule Analytics Tool. SmartPM is super easy to learn and very effective when trying to communicate what is going on in the schedule. It is so quick and easy to upload your schedules into the software and within minutes have all of the metrics at your fingertips.”
“Some metrics we looked at in the past were lagging indicators. SmartPM provides leading indicators that give us time to adjust early and with more confidence.”
“SmartPM did everything we needed it to do and more. It allows us to identify potential roadblocks in our schedule – and do it early enough to remediate the issues.”
“Information to our owners is now 10X greater than before we had SmartPM. We uncovered a lot of risks that we did not know we had.
“The dashboard is easy at a glance. You can see health, compression, and the real end date in a single view.”
“The Windows Analysis is a game changer. What used to take me weeks or months on some projects now takes minutes or hours. I don't want to analyze any project without SmartPM anymore.”
“SmartPM’s interface was superior versus the competition, with essential metrics and reports clearly displayed and easy to find.”
“SmartPM is really helping us find and deal with the flaws in our baseline schedules and weekly updated schedules. It is saving us a lot of time by providing a cheat sheet on any issues with the schedule and points us right to the issue at hand instead of having to go dig for it.”
“The integration between SmartPM and Procore is huge for us because we don’t have to reinvent the wheel. We just add SmartPM into our current process to supplement it rather than change it.”
Creating Project Controls with Schedule Data
Get to know five key metrics that can help you start creating controls in construction with your project schedule data.

How to Create a Baseline Schedule
Learn how to create a baseline schedule with conventional CPM Scheduling tools in 7 steps.

ROI for Smarter Project Management eGuide
Find out how the right analytics have led countless organizations to recognize the positive ROI for Smarter Project Management.

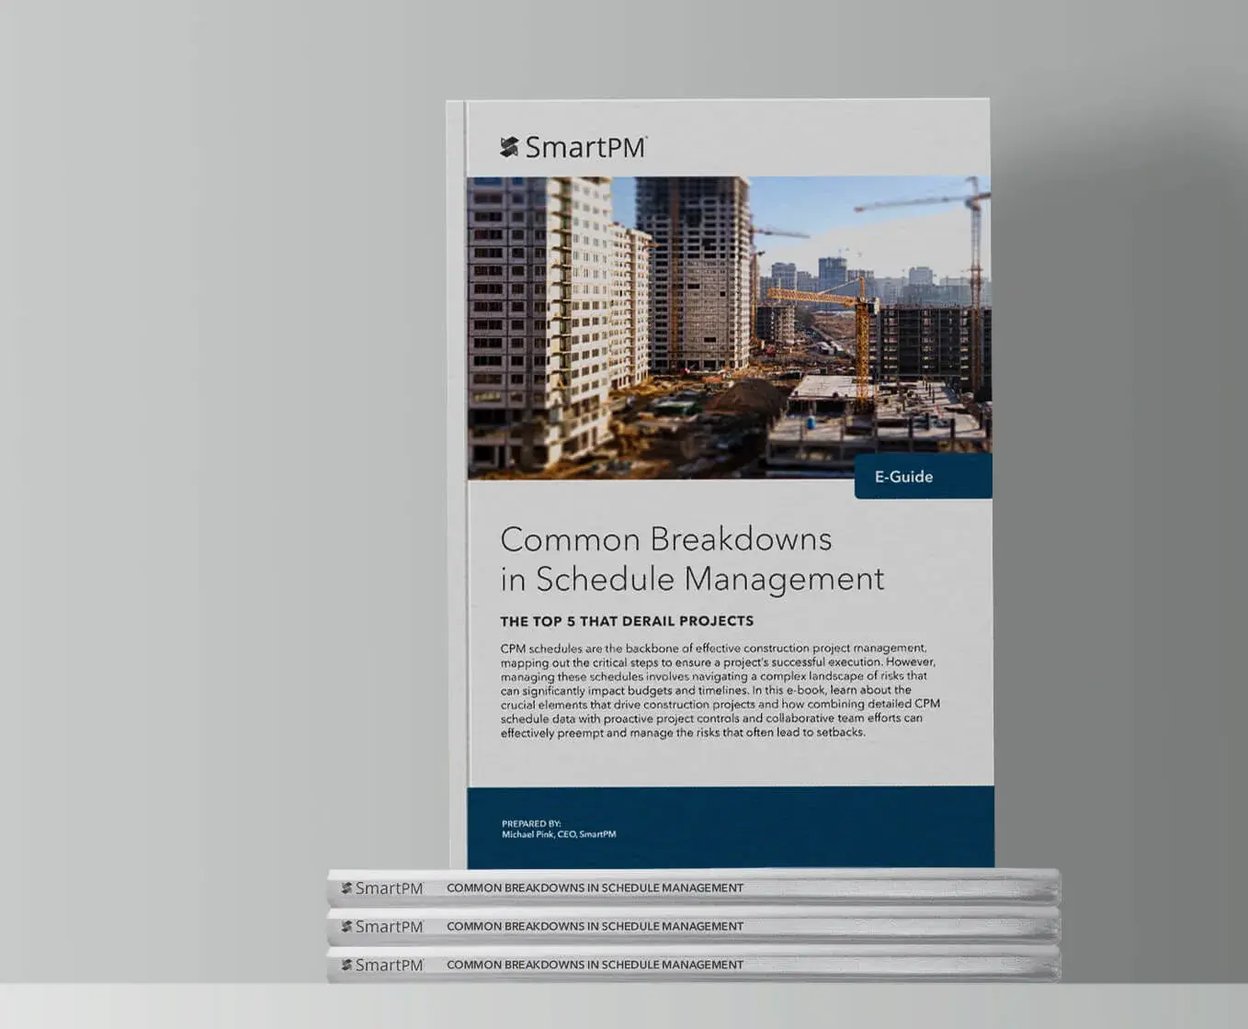
The Top 5 Breakdowns in Schedule Management
Understand five common pitfalls in construction scheduling that consistently derail projects and how to overcome them in our eGuide.
Frequently Asked Questions
Still have a question? Contact Us
-
Project controls software is critical because it connects project planning, progress tracking, and performance management in a structured, data-driven way. By automating the analysis of project schedule data, tools like SmartPM help identify risks and inefficiencies early, ensuring teams make timely decisions to avoid delays and overruns. This approach keeps projects aligned with their original goals while allowing adjustments based on real-world performance, ultimately improving execution and profitability.
-
Project controls shouldn’t be limited to the experts. Look for tools that democratize complex processes—turning raw project data into clear, actionable information everyone can use. Focus on solutions that automate data quality checks, track progress against baselines, and identify risks while adhering to industry best practices. Tools like SmartPM simplify schedule data, delivering trustworthy insights for forecasting, resource allocation, and proactive risk management. Real-time dashboards and reports provide visibility across the project lifecycle, enhance communication, and align all stakeholders, saving time and improving project control for successful projects.
-
By presenting complex data in a format teams can understand, project controls software aligns all stakeholders around clear project performance indicators. Tools like SmartPM eliminate reliance on “gut feel” by highlighting risks and trends objectively, allowing for focused conversations on resolving issues without misalignment or friction. This clarity ensures teams work toward shared goals, enabling proactive adjustments to project schedules, resources, and milestones, which keeps projects on track and minimizes disruption while supporting effective change management and risk mitigation. More clarity, less stress, more peace of mind.
The software is excellent, but the support team is even better. The human support element is a priceless feature that outweighs any product, in my professional opinion.
Live Support
From quick answers to detailed explanations, our knowledge base and client success team make it easy for you to get the most out of your data.