Manage Risk
Protect your business against the potential risk inherent to the construction industry.
Improve Project Performance
Continuous oversight of project planning and management against established benchmarks.
Control Outcomes
Capture and understand data to constructively influence project outcomes.
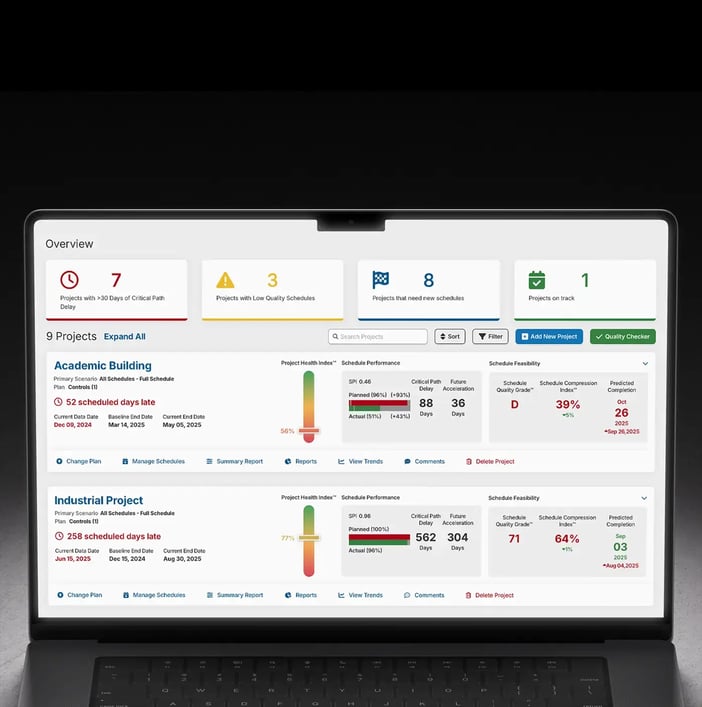
, plus summary KPI cards for total projects, on-track, and needing new schedules.")

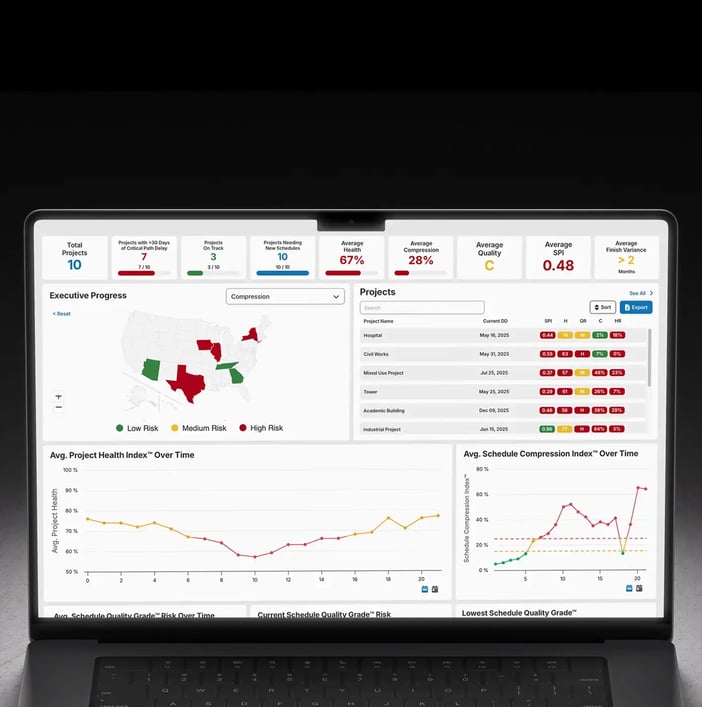
, and a schedule compression index trend line over time.")

Executive Dashboard
Make informed decisions faster with business intelligence, aggregated data, and interactive trends across your entire project portfolio.
 Read more about Executive Dashboard
Company Dashboard
A centralized view of all your project KPIs, transforming intricate data into quick and actionable information.
 Read more about Company Dashboard
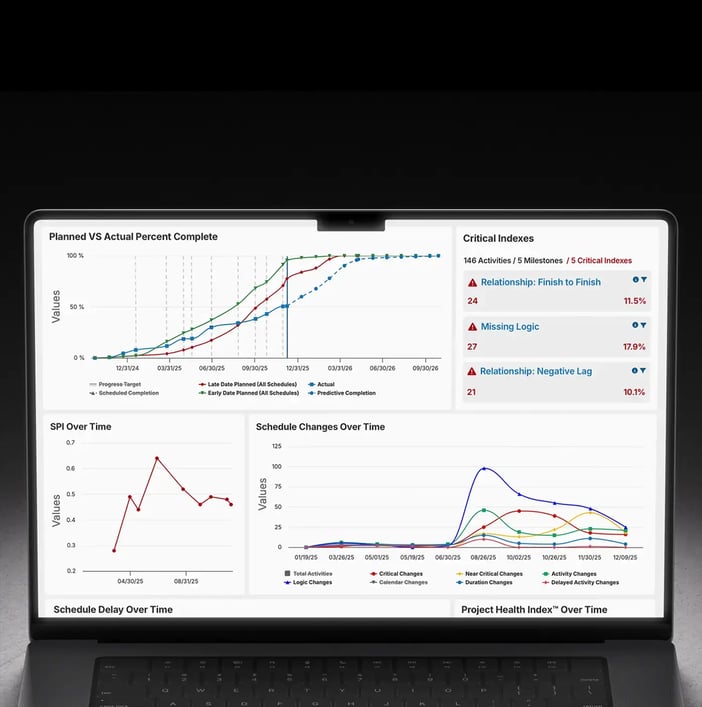
Project Workspace
Complex analytics simplified in a customized layout, designed for intuitive understanding and proactive management.
 Read more about Project Workspace
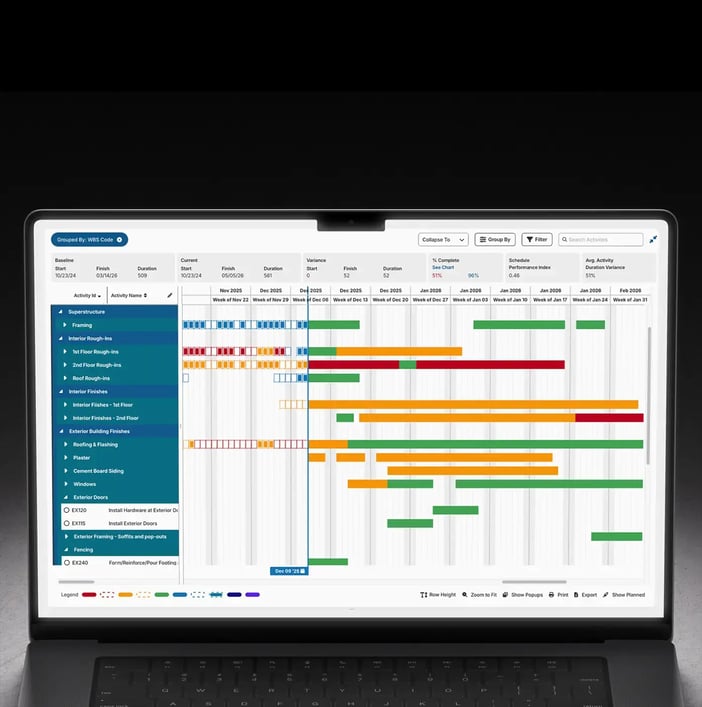
Fully Web-Based Gantt
See a dynamic view of your project’s timelines, showing historical and projected progress, delays, accelerations, and critical path activities.
 Read more about Fully Web-Based Gantt
“If your company wants to leverage data-driven, decision-making processes, and needs true insights into what’s really happening with the schedules on their projects, SmartPM is the product I would recommend.”
“Incredible Schedule Analytics Tool. SmartPM is super easy to learn and very effective when trying to communicate what is going on in the schedule. It is so quick and easy to upload your schedules into the software and within minutes have all of the metrics at your fingertips.”
“Some metrics we looked at in the past were lagging indicators. SmartPM provides leading indicators that give us time to adjust early and with more confidence.”
“SmartPM did everything we needed it to do and more. It allows us to identify potential roadblocks in our schedule – and do it early enough to remediate the issues.”
“Information to our owners is now 10X greater than before we had SmartPM. We uncovered a lot of risks that we did not know we had.
“The dashboard is easy at a glance. You can see health, compression, and the real end date in a single view.”
“The Windows Analysis is a game changer. What used to take me weeks or months on some projects now takes minutes or hours. I don't want to analyze any project without SmartPM anymore.”
“SmartPM’s interface was superior versus the competition, with essential metrics and reports clearly displayed and easy to find.”
“SmartPM is really helping us find and deal with the flaws in our baseline schedules and weekly updated schedules. It is saving us a lot of time by providing a cheat sheet on any issues with the schedule and points us right to the issue at hand instead of having to go dig for it.”
“The integration between SmartPM and Procore is huge for us because we don’t have to reinvent the wheel. We just add SmartPM into our current process to supplement it rather than change it.”